- Power BI forums
- Updates
- News & Announcements
- Get Help with Power BI
- Desktop
- Service
- Report Server
- Power Query
- Mobile Apps
- Developer
- DAX Commands and Tips
- Custom Visuals Development Discussion
- Health and Life Sciences
- Power BI Spanish forums
- Translated Spanish Desktop
- Power Platform Integration - Better Together!
- Power Platform Integrations (Read-only)
- Power Platform and Dynamics 365 Integrations (Read-only)
- Training and Consulting
- Instructor Led Training
- Dashboard in a Day for Women, by Women
- Galleries
- Community Connections & How-To Videos
- COVID-19 Data Stories Gallery
- Themes Gallery
- Data Stories Gallery
- R Script Showcase
- Webinars and Video Gallery
- Quick Measures Gallery
- 2021 MSBizAppsSummit Gallery
- 2020 MSBizAppsSummit Gallery
- 2019 MSBizAppsSummit Gallery
- Events
- Ideas
- Custom Visuals Ideas
- Issues
- Issues
- Events
- Upcoming Events
- Community Blog
- Power BI Community Blog
- Custom Visuals Community Blog
- Community Support
- Community Accounts & Registration
- Using the Community
- Community Feedback
Register now to learn Fabric in free live sessions led by the best Microsoft experts. From Apr 16 to May 9, in English and Spanish.
- Power BI forums
- Galleries
- Data Stories Gallery
- COVID 19 FOR CHILE AND LATINAMERICA


- Mark as New
- Bookmark
- Subscribe
- Mute
- Subscribe to RSS Feed
- Permalink
- Report Inappropriate Content
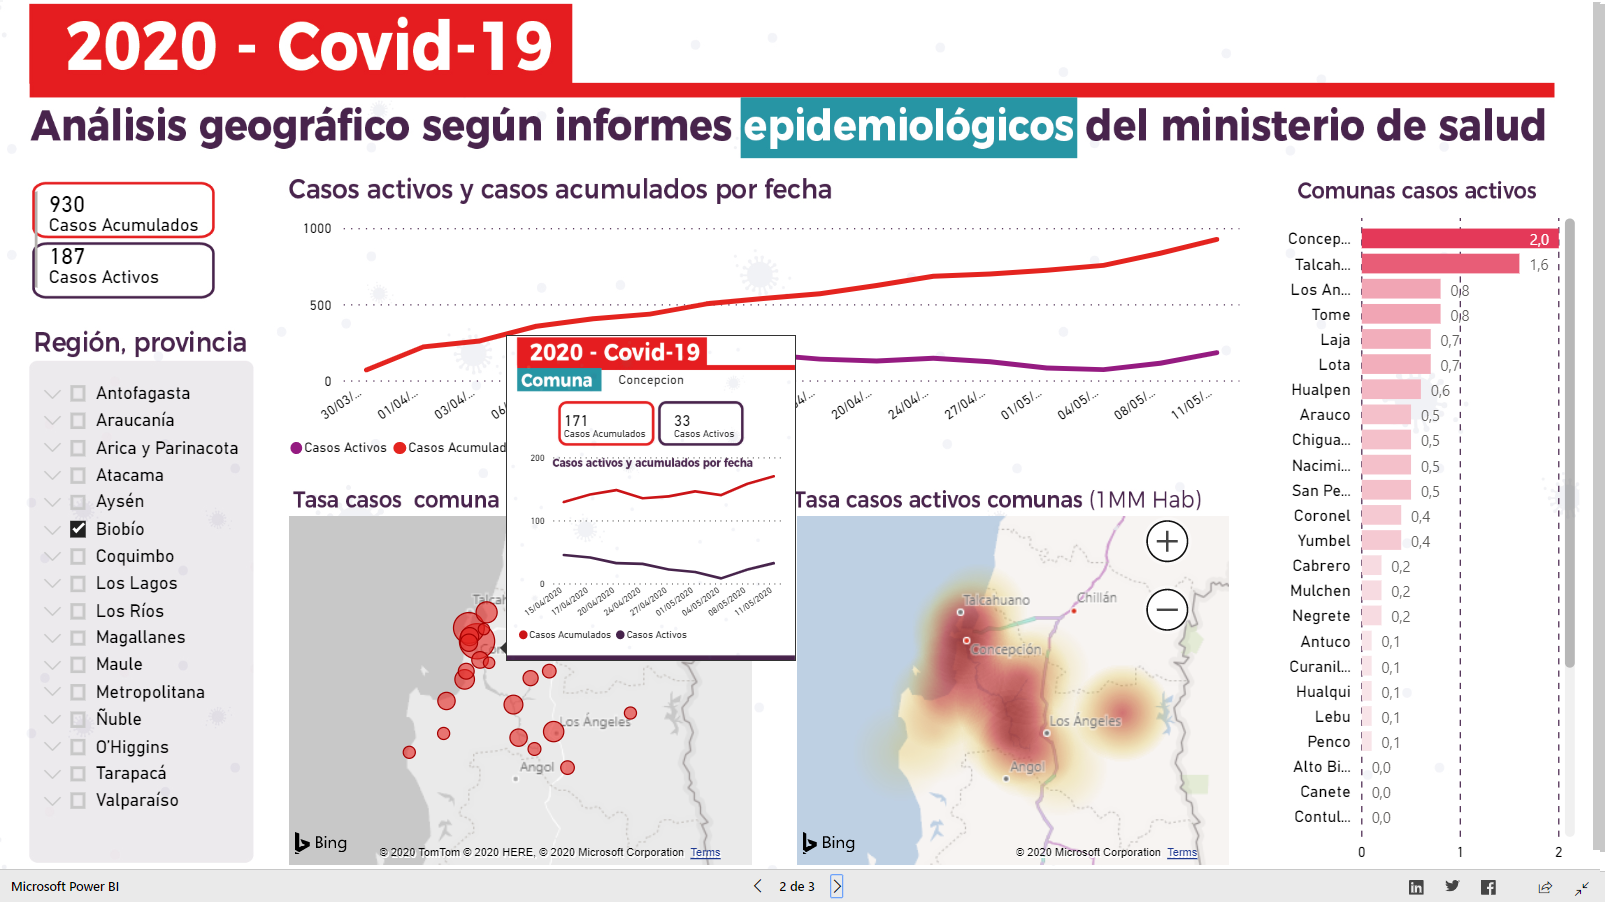
COVID 19 FOR CHILE AND LATINAMERICA
Hemos desarrollado este reporte consultando las fuentes de GitHub puestas a disposicion por el Ministerio de Ciencias de Chile y el GitHub COVID-19 Data Repository by the Center for Systems Science and Engineering (CSSE) at Johns Hopkins University.
Contiene una Visualizacion Principal con la vision actual de los tres indicadores mas importantes a nivel nacional, en la segunda pantalla contiene un desagregado a nivel comunal el cual se alimenta desde los Informes Epidemiologicos periodicos que publica el Ministerio de Salud de Chile, y la tercera pantalla realiza un comparativo de casos a nivel de tasas con todos los paises latinoamericanos.
eyJrIjoiMDk1MzE4Y2YtMTZkMC00ZWRmLTkzNGQtMGE2ZWM3NTJmMGI1IiwidCI6IjU0Yzk5Mjg4LTU3MGYtNDM1Ny04ZWM1LTg2YmQxNzNhNDk2MCIsImMiOjR9