- Power BI forums
- Updates
- News & Announcements
- Get Help with Power BI
- Desktop
- Service
- Report Server
- Power Query
- Mobile Apps
- Developer
- DAX Commands and Tips
- Custom Visuals Development Discussion
- Health and Life Sciences
- Power BI Spanish forums
- Translated Spanish Desktop
- Power Platform Integration - Better Together!
- Power Platform Integrations (Read-only)
- Power Platform and Dynamics 365 Integrations (Read-only)
- Training and Consulting
- Instructor Led Training
- Dashboard in a Day for Women, by Women
- Galleries
- Community Connections & How-To Videos
- COVID-19 Data Stories Gallery
- Themes Gallery
- Data Stories Gallery
- R Script Showcase
- Webinars and Video Gallery
- Quick Measures Gallery
- 2021 MSBizAppsSummit Gallery
- 2020 MSBizAppsSummit Gallery
- 2019 MSBizAppsSummit Gallery
- Events
- Ideas
- Custom Visuals Ideas
- Issues
- Issues
- Events
- Upcoming Events
- Community Blog
- Power BI Community Blog
- Custom Visuals Community Blog
- Community Support
- Community Accounts & Registration
- Using the Community
- Community Feedback
Register now to learn Fabric in free live sessions led by the best Microsoft experts. From Apr 16 to May 9, in English and Spanish.
- Power BI forums
- Galleries
- Data Stories Gallery
- Business Driver Chart
Business Driver Chart
02-22-2016 15:59 PM - last edited 08-09-2016 16:20 PM


- Mark as New
- Bookmark
- Subscribe
- Mute
- Subscribe to RSS Feed
- Permalink
- Report Inappropriate Content
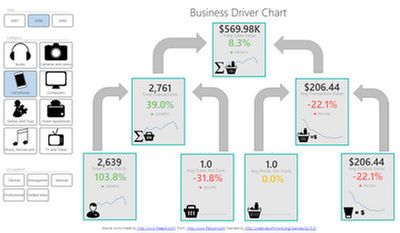
Business Driver Chart
This is a business driver chart that allows business users to understand what is driving the top line sales results. It is both intuitive and descriptive in the way it communicates the hierarchical drivers of the top line business result (ie what controllable business metrics are driving the total sales result).
The visualisation of the hierarchy allows the business user to spot opportunities in the underlying business metrics that are impacting the result (or results that are being hidden by a different business driver working in the opposite direction).
This report works best on real business data but has been reproduced here using a modified copy of the Contoso Database. The user selects a Year from the slicer and can then drill into the data by Category and/or customer occupation.
Learn more about this report from the author by watching this video: https://youtu.be/b1I1CucA1Rc

eyJrIjoiNWI3Mzc4YTMtMTliMi00ZDQzLTgzMTQtMDA5NTJlZWQ1NDYwIiwidCI6IjYwZTFmZjQwLTY4ZTAtNGUwNS1iOWJiLTExMDE3Y2M0NWNlOSIsImMiOjEwfQ
- Mark as New
- Bookmark
- Subscribe
- Mute
- Subscribe to RSS Feed
- Permalink
- Report Inappropriate Content
Great visual dashbaord and i have a similar component to my dashbaord using Chiclet slicer but i'm unable to add images which are on the local drive. I have checked the community boards/blogs but everyone has mentioned that images can be accessed through url only.
Kindly confirm if this is true!
Thank you!
- Mark as New
- Bookmark
- Subscribe
- Mute
- Subscribe to RSS Feed
- Permalink
- Report Inappropriate Content
Hi Matt, I'm patient and waiting but the sample isn't coming up for me. If there is another link to view this example that would be great. Otherwise, thanks for your contribution and maybe it will come to life here for me. It is always helpful to have subject relevant examples to show in Power BI.
- Mark as New
- Bookmark
- Subscribe
- Mute
- Subscribe to RSS Feed
- Permalink
- Report Inappropriate Content
Matt,
I really like this depiction of the business you have made. It has sparked a couple of ideas for the project I'm working on, so a huge thank you!
Regards
Paul.
Did I answer your question? Mark my post as a solution!
In doing so, you are also helping me. Thank you!
Proud to be a Super User!
Paul on Linkedin.
- Mark as New
- Bookmark
- Subscribe
- Mute
- Subscribe to RSS Feed
- Permalink
- Report Inappropriate Content
Is it possible for you to share the pbix?
- Mark as New
- Bookmark
- Subscribe
- Mute
- Subscribe to RSS Feed
- Permalink
- Report Inappropriate Content
I'll be honest - the design and layout of this are really clever and unique - very cool! However, the execution of it could be improved upon. The text box KPIs and trendlines don't always fit well. But still, very cool idea.
- Mark as New
- Bookmark
- Subscribe
- Mute
- Subscribe to RSS Feed
- Permalink
- Report Inappropriate Content
Thanks for sharing @MattAllington;
It is a great visual.
I am wondering how did you do to create the custom slicers with images and boxes? they look great.
Thanks;
Andrew
- Mark as New
- Bookmark
- Subscribe
- Mute
- Subscribe to RSS Feed
- Permalink
- Report Inappropriate Content
The "custom slicers" you mention are Chiclet Slicer (custom visual).
See here : https://powerbi.microsoft.com/fr-fr/blog/visual-awesomeness-unlocked-the-chiclet-slicer/
- Mark as New
- Bookmark
- Subscribe
- Mute
- Subscribe to RSS Feed
- Permalink
- Report Inappropriate Content
The Dashboard looks wonderful , can you please share the PBIX file .So tht it helps me in one of the requirements.
Regards,
Murali
- Mark as New
- Bookmark
- Subscribe
- Mute
- Subscribe to RSS Feed
- Permalink
- Report Inappropriate Content
Hi @muraliketh
Matt wrote an article and recorded a video to explain the logic behind this dashboard: http://exceleratorbi.com.au/power-bi-public-story-telling-is-pure-genius/.
He also attached an Excel file that contains all the measures used in this report at the end of his article.
(Attached also in my post).
Enjoy !!
- Mark as New
- Bookmark
- Subscribe
- Mute
- Subscribe to RSS Feed
- Permalink
- Report Inappropriate Content
Where can I download this visual?