- Power BI forums
- Updates
- News & Announcements
- Get Help with Power BI
- Desktop
- Service
- Report Server
- Power Query
- Mobile Apps
- Developer
- DAX Commands and Tips
- Custom Visuals Development Discussion
- Health and Life Sciences
- Power BI Spanish forums
- Translated Spanish Desktop
- Power Platform Integration - Better Together!
- Power Platform Integrations (Read-only)
- Power Platform and Dynamics 365 Integrations (Read-only)
- Training and Consulting
- Instructor Led Training
- Dashboard in a Day for Women, by Women
- Galleries
- Community Connections & How-To Videos
- COVID-19 Data Stories Gallery
- Themes Gallery
- Data Stories Gallery
- R Script Showcase
- Webinars and Video Gallery
- Quick Measures Gallery
- 2021 MSBizAppsSummit Gallery
- 2020 MSBizAppsSummit Gallery
- 2019 MSBizAppsSummit Gallery
- Events
- Ideas
- Custom Visuals Ideas
- Issues
- Issues
- Events
- Upcoming Events
- Community Blog
- Power BI Community Blog
- Custom Visuals Community Blog
- Community Support
- Community Accounts & Registration
- Using the Community
- Community Feedback
Register now to learn Fabric in free live sessions led by the best Microsoft experts. From Apr 16 to May 9, in English and Spanish.
- Power BI forums
- Forums
- Get Help with Power BI
- DAX Commands and Tips
- Re: sum of max values when selcting multiple slice...
- Subscribe to RSS Feed
- Mark Topic as New
- Mark Topic as Read
- Float this Topic for Current User
- Bookmark
- Subscribe
- Printer Friendly Page
- Mark as New
- Bookmark
- Subscribe
- Mute
- Subscribe to RSS Feed
- Permalink
- Report Inappropriate Content
sum of max values when selcting multiple slicer values
Hi,
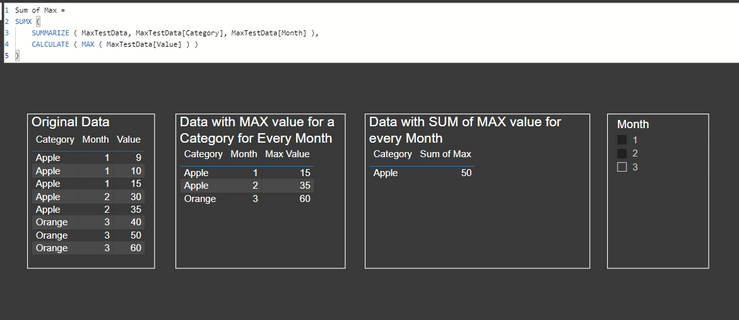
Below is the data, i have category and value fields. and Month as slicer.
each month has different values and i needd to take only max value of each month.
and here i am taking max value easily.
here the problem is.. when i select multiple months from slicer.
i need sum value of the max.
fo example. Month1 Appls has 15 as max value and in month 2 max value is 35.
when i select both months. i need to show 50 for Apple.
but here it is taking max value of the both months.
need help how to acheive this.
@Pragati11 @amitchandak @Greg_Deckler @mwegener @lbendlin @Fowmy
Solved! Go to Solution.
- Mark as New
- Bookmark
- Subscribe
- Mute
- Subscribe to RSS Feed
- Permalink
- Report Inappropriate Content
Hi @Anonymous ,
There are already existing threads for this issue:
https://community.powerbi.com/t5/Desktop/sum-of-max-values-by-date-client/td-p/247337
https://community.powerbi.com/t5/Desktop/sum-of-max-values/td-p/46715
I tried the first link's solution and it works:
Thanks,
Pragati
- Mark as New
- Bookmark
- Subscribe
- Mute
- Subscribe to RSS Feed
- Permalink
- Report Inappropriate Content
- Mark as New
- Bookmark
- Subscribe
- Mute
- Subscribe to RSS Feed
- Permalink
- Report Inappropriate Content
if i select mutiple months from slicer,
i need to see for Apple 50
not like the below. which is just taking max of the month.
- Mark as New
- Bookmark
- Subscribe
- Mute
- Subscribe to RSS Feed
- Permalink
- Report Inappropriate Content
Hi @Anonymous ,
There are already existing threads for this issue:
https://community.powerbi.com/t5/Desktop/sum-of-max-values-by-date-client/td-p/247337
https://community.powerbi.com/t5/Desktop/sum-of-max-values/td-p/46715
I tried the first link's solution and it works:
Thanks,
Pragati
- Mark as New
- Bookmark
- Subscribe
- Mute
- Subscribe to RSS Feed
- Permalink
- Report Inappropriate Content
thanks for your prompt response. this works for me.
Yes, i have gone through the links you gave below earlier.
But in their case they just want to show max values.
However in my case i need to show max values with cummulative sum based on slicer seelction.
All trick and magic lied in Summarize function.
So, i tweaked my DAX now it is working fine. 🙂
- Mark as New
- Bookmark
- Subscribe
- Mute
- Subscribe to RSS Feed
- Permalink
- Report Inappropriate Content
- Mark as New
- Bookmark
- Subscribe
- Mute
- Subscribe to RSS Feed
- Permalink
- Report Inappropriate Content
Hi @Anonymous ,
Can you paste this as a table please rather than a screenshot so that I can copy paste at my end?
Helpful resources

Microsoft Fabric Learn Together
Covering the world! 9:00-10:30 AM Sydney, 4:00-5:30 PM CET (Paris/Berlin), 7:00-8:30 PM Mexico City

Power BI Monthly Update - April 2024
Check out the April 2024 Power BI update to learn about new features.

| User | Count |
|---|---|
| 49 | |
| 25 | |
| 20 | |
| 15 | |
| 12 |
| User | Count |
|---|---|
| 57 | |
| 49 | |
| 44 | |
| 19 | |
| 18 |


