- Power BI forums
- Updates
- News & Announcements
- Get Help with Power BI
- Desktop
- Service
- Report Server
- Power Query
- Mobile Apps
- Developer
- DAX Commands and Tips
- Custom Visuals Development Discussion
- Health and Life Sciences
- Power BI Spanish forums
- Translated Spanish Desktop
- Power Platform Integration - Better Together!
- Power Platform Integrations (Read-only)
- Power Platform and Dynamics 365 Integrations (Read-only)
- Training and Consulting
- Instructor Led Training
- Dashboard in a Day for Women, by Women
- Galleries
- Community Connections & How-To Videos
- COVID-19 Data Stories Gallery
- Themes Gallery
- Data Stories Gallery
- R Script Showcase
- Webinars and Video Gallery
- Quick Measures Gallery
- 2021 MSBizAppsSummit Gallery
- 2020 MSBizAppsSummit Gallery
- 2019 MSBizAppsSummit Gallery
- Events
- Ideas
- Custom Visuals Ideas
- Issues
- Issues
- Events
- Upcoming Events
- Community Blog
- Power BI Community Blog
- Custom Visuals Community Blog
- Community Support
- Community Accounts & Registration
- Using the Community
- Community Feedback
Register now to learn Fabric in free live sessions led by the best Microsoft experts. From Apr 16 to May 9, in English and Spanish.
- Power BI forums
- Forums
- Get Help with Power BI
- DAX Commands and Tips
- Re: Using ALL to ignore filters- strange results
- Subscribe to RSS Feed
- Mark Topic as New
- Mark Topic as Read
- Float this Topic for Current User
- Bookmark
- Subscribe
- Printer Friendly Page
- Mark as New
- Bookmark
- Subscribe
- Mute
- Subscribe to RSS Feed
- Permalink
- Report Inappropriate Content
Using ALL to ignore filters- strange results
Hi
I've created a dashboard with slicers on "Order Date" and "Category":
I'm trying to add 3 cards to the dashboard:
The first should ignore ignore all filters. It uses the following Measure:
Grand Total = CALCULATE([Sales Total],ALL(Sales[Customer]),ALL(Sales[OrderDate]),ALL('DATE _TABLE'[YearQuarter]))
The second should ignore the "Category" filter, but respect the "Date" filter. It uses the following Measure:
GrandTot DATES Selection = CALCULATE([Sales Total],ALL(Sales[Category]))
The third should respect the "Date" filter but ignore the "Category" filter. It uses the following Measure:
GrandTot CATS Selection = CALCULATE([Sales Total],ALL(Sales[OrderDate]),ALL('DATE _TABLE'[YearQuarter]))
Problem is:
- if I DON'T touch the "Date" slicer, the second card ignores any "category" selections;
- BUT if I DO change the "Date" slicer the second card DOES repsect the "Category" slicer
Example is at:
https://1drv.ms/u/s!AmxJyApgEAcYgtZqhTkd8PCAT0uJZQ
Any ideas?
Thanks!
Solved! Go to Solution.
- Mark as New
- Bookmark
- Subscribe
- Mute
- Subscribe to RSS Feed
- Permalink
- Report Inappropriate Content
oldhasbeen,
I've just got back to looking at this and there is definitely an issue. In my opinion there is nothing wrong with the original measure using ALL.
First of all, I think I have a solution to the issue . You have a DATE table in the model so get rid of the Order Date slicer and replace it with a slicer using Date from Date_Table. (This is actually good practice since that is what Date tables are for). This should let the measure start working properly again. Let me know how you get on.
Now, the original issue. I don't know if powerbi has always been like that but there is something unintuitive (or buggy) about using 2 slicers on the same table (one should be a date range slicer) along with a measure that uses ALL on the other field in the slicer. I'm going to investigate more but it looks to me that the 2 slicers filter each other but the date range slicer doesn't update to reflect the choice in the other slicer. And the result on the measure does not reflect what's on screen. I'll get back to you on this or attempt to escalate to MS.
- Mark as New
- Bookmark
- Subscribe
- Mute
- Subscribe to RSS Feed
- Permalink
- Report Inappropriate Content
Just to confirm, we are talking about the GrandTot DATES Selection = CALCULATE([Sales Total],ALL(Sales[Category]))
I've just tested by moving the date slicer to 4 Jan 2018 - 5 Jan 2017, the measure returns 13.38K.
'Bars' is already selected in the Category slicer.
In the Sales table, there are two records within the date period selected (I got lucky because one is in 'Bars' and one is in 'Crackers'
Ok, if the measure was respecting the Category filter, it should return only the 3971.88.
Do you agree with the test? What results are you getting?
- Mark as New
- Bookmark
- Subscribe
- Mute
- Subscribe to RSS Feed
- Permalink
- Report Inappropriate Content
Thanks for the rapid reply.
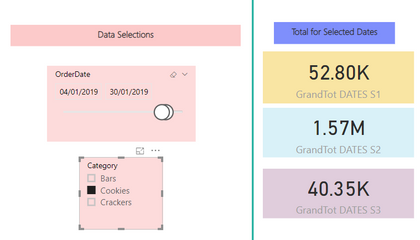
With your data selections I get the same results as you, which looks fine; however, if I select some different data, I get problems, e.g. if I select only data for January 2019:
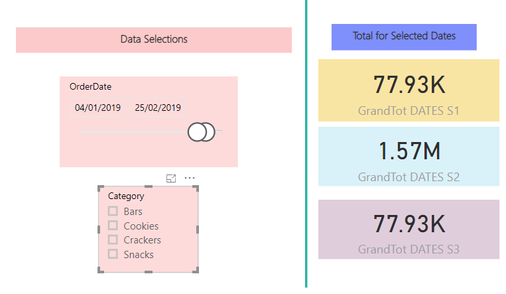
If I don't select a category, the results are as I expect:
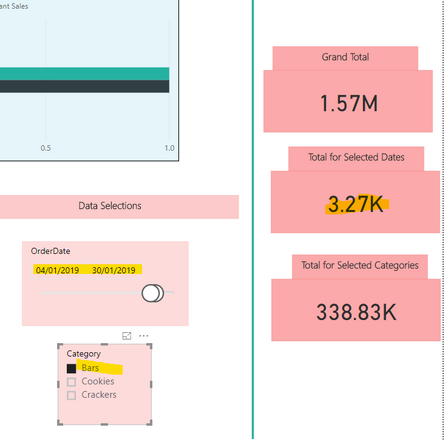
IfI Select "Bars", the result seems to respect the Category filter, despite the ALL(Sales[Category])) code:
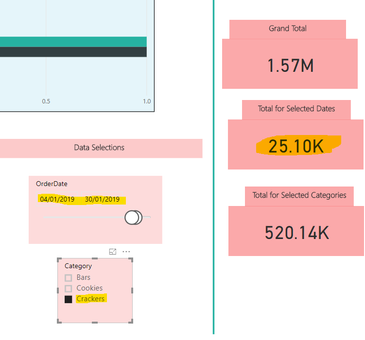
.. but if I select "Crackers" the result makes no sense at all! If Card 2 is respecting the filter I'd expect it to show £1.24K (i.e. £12,448.83)
Any ideas?
- Mark as New
- Bookmark
- Subscribe
- Mute
- Subscribe to RSS Feed
- Permalink
- Report Inappropriate Content
You need to use the ALLEXCEPT function in your case.
https://docs.microsoft.com/en-us/dax/allexcept-function-dax
Removes all context filters in the table except filters that have been applied to the specified columns.
- Mark as New
- Bookmark
- Subscribe
- Mute
- Subscribe to RSS Feed
- Permalink
- Report Inappropriate Content
I've tried every permutation of ALLEXCEPT I can think of, i.e.


- Mark as New
- Bookmark
- Subscribe
- Mute
- Subscribe to RSS Feed
- Permalink
- Report Inappropriate Content
oldhasbeen,
I've just got back to looking at this and there is definitely an issue. In my opinion there is nothing wrong with the original measure using ALL.
First of all, I think I have a solution to the issue . You have a DATE table in the model so get rid of the Order Date slicer and replace it with a slicer using Date from Date_Table. (This is actually good practice since that is what Date tables are for). This should let the measure start working properly again. Let me know how you get on.
Now, the original issue. I don't know if powerbi has always been like that but there is something unintuitive (or buggy) about using 2 slicers on the same table (one should be a date range slicer) along with a measure that uses ALL on the other field in the slicer. I'm going to investigate more but it looks to me that the 2 slicers filter each other but the date range slicer doesn't update to reflect the choice in the other slicer. And the result on the measure does not reflect what's on screen. I'll get back to you on this or attempt to escalate to MS.
- Mark as New
- Bookmark
- Subscribe
- Mute
- Subscribe to RSS Feed
- Permalink
- Report Inappropriate Content
Hi HotChilli
This looks good!Thanks for your time & patience.
My solution is at https://1drv.ms/u/s!AmxJyApgEAcYgtcGRfnihvxdr4aWIA, if you are interested.
I'm a little surprised at your comment that there is "something unintuitive (or buggy) about using 2 slicers on the same table ", it's something I've been doing with Excel Pivot Tables for years.
- Mark as New
- Bookmark
- Subscribe
- Mute
- Subscribe to RSS Feed
- Permalink
- Report Inappropriate Content
That's not the whole quote.
In the particular circumstances there does look to be something unintuitive.
Excel is different to powerbi of course.
Visuals affect each other unless 'Edit Interactions' is used
Helpful resources

Microsoft Fabric Learn Together
Covering the world! 9:00-10:30 AM Sydney, 4:00-5:30 PM CET (Paris/Berlin), 7:00-8:30 PM Mexico City

Power BI Monthly Update - April 2024
Check out the April 2024 Power BI update to learn about new features.

| User | Count |
|---|---|
| 43 | |
| 23 | |
| 21 | |
| 15 | |
| 15 |
| User | Count |
|---|---|
| 46 | |
| 31 | |
| 30 | |
| 18 | |
| 18 |


