- Power BI forums
- Updates
- News & Announcements
- Get Help with Power BI
- Desktop
- Service
- Report Server
- Power Query
- Mobile Apps
- Developer
- DAX Commands and Tips
- Custom Visuals Development Discussion
- Health and Life Sciences
- Power BI Spanish forums
- Translated Spanish Desktop
- Power Platform Integration - Better Together!
- Power Platform Integrations (Read-only)
- Power Platform and Dynamics 365 Integrations (Read-only)
- Training and Consulting
- Instructor Led Training
- Dashboard in a Day for Women, by Women
- Galleries
- Community Connections & How-To Videos
- COVID-19 Data Stories Gallery
- Themes Gallery
- Data Stories Gallery
- R Script Showcase
- Webinars and Video Gallery
- Quick Measures Gallery
- 2021 MSBizAppsSummit Gallery
- 2020 MSBizAppsSummit Gallery
- 2019 MSBizAppsSummit Gallery
- Events
- Ideas
- Custom Visuals Ideas
- Issues
- Issues
- Events
- Upcoming Events
- Community Blog
- Power BI Community Blog
- Custom Visuals Community Blog
- Community Support
- Community Accounts & Registration
- Using the Community
- Community Feedback
Register now to learn Fabric in free live sessions led by the best Microsoft experts. From Apr 16 to May 9, in English and Spanish.
- Power BI forums
- Forums
- Get Help with Power BI
- DAX Commands and Tips
- Sum of Average Sum
- Subscribe to RSS Feed
- Mark Topic as New
- Mark Topic as Read
- Float this Topic for Current User
- Bookmark
- Subscribe
- Printer Friendly Page
- Mark as New
- Bookmark
- Subscribe
- Mute
- Subscribe to RSS Feed
- Permalink
- Report Inappropriate Content
Sum of Average Sum
Hi experts
Ive had a read around the forum and not quite found what I'm looking for.
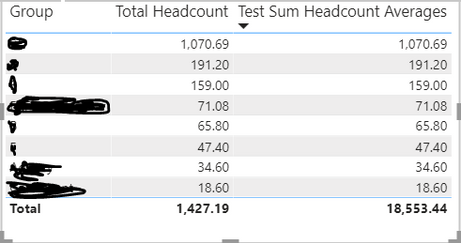
Example table of data below. The table shows headcount by site (column is actually called 'Full Name'), each site is in a group. I am trying to calcuate the total headcount for the month.
The steps involved to get total headcount are
1) find the average monthly headcount for each office / site ( 2nd table from the left on snippet)
2) sum the office/site averages to get headcount per group (3rd table from the left on snippet)
3) sum the group values to get total headcount (4th table from the left on snippet)
The dataset covers a number of months but I am using a relative date filter on the visual of 'in the last 1 calendar month' to filter down. The data set contains dates rather than month/year. month/year was in an attempt to simplify the example data
I have got as far as step 2 above using DAX formula

As expected the total of 1,427.19, 'provided' by the table is wrong so I tried to using the formula as a variable in a calculation using 'HASONEVALUE'
- Mark as New
- Bookmark
- Subscribe
- Mute
- Subscribe to RSS Feed
- Permalink
- Report Inappropriate Content
Hi @Hanshans
First of all, you should clearly state the inputs. Can you therefore please describe (in the best way possible, maybe paste a picture) the table(s) you work with? We don't want to see 'a simplified view' of your data. We want to see your data. This is the first thing. You say "The data set contains dates rather than month/year." So, please show us the real thing, not some kind of simplification. If someone writes code that works with a 'simplification,' then the code may not work with the real thing. It'll be a waste of everybody's time.
Also, it's always good to state: the input, the transformation and the output. Best in the form of pictures as for the input and output. The explanation of transformation should be easily derived (by the reader) from the pictures but you can add your own words if you feel it's not clear enough.
You do the above and I'll try to figure something out with the info I already have.
Thanks.
- Mark as New
- Bookmark
- Subscribe
- Mute
- Subscribe to RSS Feed
- Permalink
- Report Inappropriate Content
Here's your code:
AVG =
var LocationInScope = ISINSCOPE( T[Location] )
var GroupInScope = ISINSCOPE( T[Group] )
var MonthInScope = ISINSCOPE( T[Month] )
var Result =
    SWITCH( TRUE(),
        MonthInScope && GroupInScope && LocationInScope, AVERAGE( T[Headcount] ),
        MonthInScope && GroupInScope && not LocationInScope,
            AVERAGEX(
                DISTINCT( T[Location] ),
                CALCULATE( AVERAGE( T[Headcount] ) )
            ),
        MonthInScope && not GroupInScope && not LocationInScope,
            AVERAGEX(
                DISTINCT( T[Group] ),
                CALCULATE(
                    AVERAGEX(
                        DISTINCT( T[Location] ),
                        CALCULATE( AVERAGE( T[Headcount] ) )
                    )
                )
            ),
        not ( MonthInScope || GroupInScope || LocationInScope ),
        AVERAGEX(
            DISTINCT( T[Month] ),
                CALCULATE(
                AVERAGEX(
                    DISTINCT( T[Group] ),
                    CALCULATE(
                        AVERAGEX(
                            DISTINCT( T[Location] ),
                            CALCULATE( AVERAGE( T[Headcount] ) )
                        )
                    )
                )
            )
        )
    )
return
    Result
T[Location] is your T[Office/Site].
- Mark as New
- Bookmark
- Subscribe
- Mute
- Subscribe to RSS Feed
- Permalink
- Report Inappropriate Content
Hi,
I would suggest an AverageX for the inner average.
Kind regards, Steve.
Proud to be a Super User!
Awesome Keyboard Shortcusts in Power BI, thumbs up if you like the article
My Community Blog Articles (check them out!)
My Blog - Power M code to automatically detect column types -
How to create test data using DAX!
Helpful resources

Microsoft Fabric Learn Together
Covering the world! 9:00-10:30 AM Sydney, 4:00-5:30 PM CET (Paris/Berlin), 7:00-8:30 PM Mexico City

Power BI Monthly Update - April 2024
Check out the April 2024 Power BI update to learn about new features.

| User | Count |
|---|---|
| 42 | |
| 21 | |
| 21 | |
| 14 | |
| 13 |
| User | Count |
|---|---|
| 43 | |
| 39 | |
| 33 | |
| 18 | |
| 17 |

