- Power BI forums
- Updates
- News & Announcements
- Get Help with Power BI
- Desktop
- Service
- Report Server
- Power Query
- Mobile Apps
- Developer
- DAX Commands and Tips
- Custom Visuals Development Discussion
- Health and Life Sciences
- Power BI Spanish forums
- Translated Spanish Desktop
- Power Platform Integration - Better Together!
- Power Platform Integrations (Read-only)
- Power Platform and Dynamics 365 Integrations (Read-only)
- Training and Consulting
- Instructor Led Training
- Dashboard in a Day for Women, by Women
- Galleries
- Community Connections & How-To Videos
- COVID-19 Data Stories Gallery
- Themes Gallery
- Data Stories Gallery
- R Script Showcase
- Webinars and Video Gallery
- Quick Measures Gallery
- 2021 MSBizAppsSummit Gallery
- 2020 MSBizAppsSummit Gallery
- 2019 MSBizAppsSummit Gallery
- Events
- Ideas
- Custom Visuals Ideas
- Issues
- Issues
- Events
- Upcoming Events
- Community Blog
- Power BI Community Blog
- Custom Visuals Community Blog
- Community Support
- Community Accounts & Registration
- Using the Community
- Community Feedback
Register now to learn Fabric in free live sessions led by the best Microsoft experts. From Apr 16 to May 9, in English and Spanish.
- Power BI forums
- Forums
- Get Help with Power BI
- DAX Commands and Tips
- Re: Show results before and after a chosen date (w...
- Subscribe to RSS Feed
- Mark Topic as New
- Mark Topic as Read
- Float this Topic for Current User
- Bookmark
- Subscribe
- Printer Friendly Page
- Mark as New
- Bookmark
- Subscribe
- Mute
- Subscribe to RSS Feed
- Permalink
- Report Inappropriate Content
Show results before and after a chosen date (when referencing two date tables)
Long-time prowler. First time posting. Here’s my dilemma:
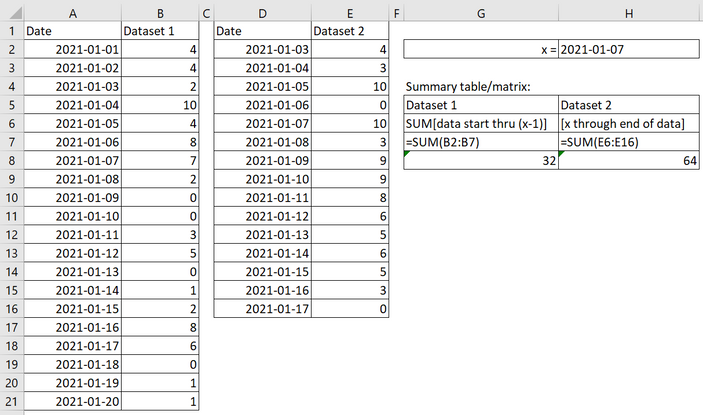
I have two datasets, each organized by date. The data tables DO NOT have the same start/end date. I would like to choose a date (x in this example). Based on x, I want to sum() dataset 1 until the day prior to x. And sum() dataset 2 from x forward.
I have found several solutions that get me close, but because the two datasets are different fact tables (with non-matching dates), I am stumped when it comes to developing a summary table/matrix that encompass both datasets.
- Mark as New
- Bookmark
- Subscribe
- Mute
- Subscribe to RSS Feed
- Permalink
- Report Inappropriate Content
Create a calendar table that can act as a dimension table to your two fact tables, and that can feed your slicer.
- Mark as New
- Bookmark
- Subscribe
- Mute
- Subscribe to RSS Feed
- Permalink
- Report Inappropriate Content
I believe I tried what you are suggesting. I followed this tutorial:
https://www.youtube.com/watch?v=zYIxukD2KCM
The issue, though, is non-matching date tables. For context, I'm creating an Accounts Receivable report. It pulls in all past data until this date selected. Then - pulling from another fact table - pulls the remaining data.
I can accomplish this if I use two matrices and manually manipulate the date filter. However, my goal is to have this in one matrix with one slicer (and a date variable, I suppose) so that the report looks more orderly.
- Mark as New
- Bookmark
- Subscribe
- Mute
- Subscribe to RSS Feed
- Permalink
- Report Inappropriate Content
Hello @bdeluca ,
From what I've got from your explanation is that you need 2 measures and a slicer.
Indeed, you need to create a dimention table to be used in your slicer that will contain all the dates from both tables. You can create it either in Power Query or DAX based on either provided start/end date or on min/max dates of youe existing fact tables.
Measures that might be used:
#Dataset_1 =
VAR selectedDate = SELECTEDVALUE(Calendar[Date])
RETURN
    SUMX(
        FILTER(ALL(Dataset1), Dataset1[Date] < selectedDate),
        Dataset1[Dataset1]
    )

#Dataset_2 =
VAR selectedDate = SELECTEDVALUE(Calendar[Date])
RETURN
    SUMX(
        FILTER(ALL(Dataset2), Dataset2[Date] >= selectedDate),
        Dataset2[Dataset2]
    )
If this post helps, then please consider Accept it as the solution to help the other members find it more quickly. Appreciate your Kudos.
Check out my latest demo report in the data story gallery.
Stand with Ukraine!
Here are official ways you can support Ukraine financially (accounts with multiple currencies):
1) Support the Armed Forces of Ukraine: https://bank.gov.ua/ua/about/support-the-armed-forces
2) Come Back Alive foundation: https://www.comebackalive.in.ua/
Thank you!
Helpful resources

Microsoft Fabric Learn Together
Covering the world! 9:00-10:30 AM Sydney, 4:00-5:30 PM CET (Paris/Berlin), 7:00-8:30 PM Mexico City

Power BI Monthly Update - April 2024
Check out the April 2024 Power BI update to learn about new features.

| User | Count |
|---|---|
| 39 | |
| 19 | |
| 17 | |
| 16 | |
| 16 |
| User | Count |
|---|---|
| 50 | |
| 24 | |
| 21 | |
| 17 | |
| 16 |

