- Power BI forums
- Updates
- News & Announcements
- Get Help with Power BI
- Desktop
- Service
- Report Server
- Power Query
- Mobile Apps
- Developer
- DAX Commands and Tips
- Custom Visuals Development Discussion
- Health and Life Sciences
- Power BI Spanish forums
- Translated Spanish Desktop
- Power Platform Integration - Better Together!
- Power Platform Integrations (Read-only)
- Power Platform and Dynamics 365 Integrations (Read-only)
- Training and Consulting
- Instructor Led Training
- Dashboard in a Day for Women, by Women
- Galleries
- Community Connections & How-To Videos
- COVID-19 Data Stories Gallery
- Themes Gallery
- Data Stories Gallery
- R Script Showcase
- Webinars and Video Gallery
- Quick Measures Gallery
- 2021 MSBizAppsSummit Gallery
- 2020 MSBizAppsSummit Gallery
- 2019 MSBizAppsSummit Gallery
- Events
- Ideas
- Custom Visuals Ideas
- Issues
- Issues
- Events
- Upcoming Events
- Community Blog
- Power BI Community Blog
- Custom Visuals Community Blog
- Community Support
- Community Accounts & Registration
- Using the Community
- Community Feedback
Register now to learn Fabric in free live sessions led by the best Microsoft experts. From Apr 16 to May 9, in English and Spanish.
- Power BI forums
- Forums
- Get Help with Power BI
- DAX Commands and Tips
- PowerBI - Timeseries of categorical changes
- Subscribe to RSS Feed
- Mark Topic as New
- Mark Topic as Read
- Float this Topic for Current User
- Bookmark
- Subscribe
- Printer Friendly Page
- Mark as New
- Bookmark
- Subscribe
- Mute
- Subscribe to RSS Feed
- Permalink
- Report Inappropriate Content
PowerBI - Timeseries of categorical changes
Hello all,
I have a simplified PowerBI data model here: https://drive.google.com/file/d/13aXUR8mw2MdP3tw9K9LHxhqRCZqPaLwz/view?usp=share_link
I want to make a timeseries visual that accounts for when a user's status category changes over time.
This is what the model looks like:

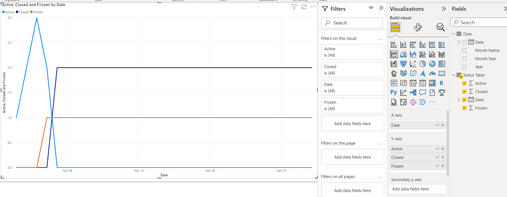
The current status table shows the status of users TODAY, and there is a separate table tracking the historical changes to their status. The visual so far looks like this:

I need a measure of some kind that will evaluate the correct count of users' status over time. Something like:

I have tried using LOOKUPVALUE, and different forms of CALCULATE but I haven't gotten very far.
Any help is greatly appreciated! Thank you
- Mark as New
- Bookmark
- Subscribe
- Mute
- Subscribe to RSS Feed
- Permalink
- Report Inappropriate Content
Test this out with your dataset...
This query finds the number of Actives, Frozen, Closed on a given day. I haven't tested if it works when users change from Frozen/Closed back to Active. Here is an output line chart:
let
Source = ***ENTER SOURCE HERE***,
#"Changed Type" = Table.TransformColumnTypes(Source,{{"Date", type date}, {"User ID", type text}, {"Status", type text}}),
#"Pivoted Column" = Table.Pivot(#"Changed Type", List.Distinct(#"Changed Type"[#"User ID"]), "User ID", "Status"),
#"Filled Down" = Table.FillDown(#"Pivoted Column",{"1", "2", "3"}),
#"Merged Queries" = Table.NestedJoin(#"Filled Down", {"Date"}, Date, {"Date"}, "Query1", JoinKind.RightOuter),
#"Expanded Query1" = Table.ExpandTableColumn(#"Merged Queries", "Query1", {"Date"}, {"Query1.Date"}),
#"Filtered Rows" = Table.SelectRows(#"Expanded Query1", each Date.IsInPreviousNMonths([Query1.Date], 2)),
#"Removed Columns1" = Table.RemoveColumns(#"Filtered Rows",{"Date"}),
#"Reordered Columns" = Table.ReorderColumns(#"Removed Columns1",{"Query1.Date", "1", "2", "3"}),
#"Renamed Columns" = Table.RenameColumns(#"Reordered Columns",{{"Query1.Date", "Date"}}),
#"Filled Down2" = Table.FillDown(#"Renamed Columns",{"1", "2", "3"}),
#"Unpivoted Columns" = Table.UnpivotOtherColumns(#"Filled Down2", {"Date"}, "Attribute", "Value"),
#"Pivoted Column1" = Table.Pivot(#"Unpivoted Columns", List.Distinct(#"Unpivoted Columns"[Value]), "Value", "Attribute", List.Count),
#"Sorted Rows" = Table.Sort(#"Pivoted Column1",{{"Date", Order.Ascending}})
in
#"Sorted Rows"
- Mark as New
- Bookmark
- Subscribe
- Mute
- Subscribe to RSS Feed
- Permalink
- Report Inappropriate Content
Hello brtfrschnr,
Thank you for your response. I submitted this as a simplified data model with hopes that I can find a methodology with a DAX abstraction. It isn't as feasible for me to restructure the "actual" model in PowerQuery.
Helpful resources

Microsoft Fabric Learn Together
Covering the world! 9:00-10:30 AM Sydney, 4:00-5:30 PM CET (Paris/Berlin), 7:00-8:30 PM Mexico City

Power BI Monthly Update - April 2024
Check out the April 2024 Power BI update to learn about new features.

| User | Count |
|---|---|
| 47 | |
| 24 | |
| 20 | |
| 15 | |
| 12 |
| User | Count |
|---|---|
| 55 | |
| 48 | |
| 43 | |
| 19 | |
| 19 |

