- Power BI forums
- Updates
- News & Announcements
- Get Help with Power BI
- Desktop
- Service
- Report Server
- Power Query
- Mobile Apps
- Developer
- DAX Commands and Tips
- Custom Visuals Development Discussion
- Health and Life Sciences
- Power BI Spanish forums
- Translated Spanish Desktop
- Power Platform Integration - Better Together!
- Power Platform Integrations (Read-only)
- Power Platform and Dynamics 365 Integrations (Read-only)
- Training and Consulting
- Instructor Led Training
- Dashboard in a Day for Women, by Women
- Galleries
- Community Connections & How-To Videos
- COVID-19 Data Stories Gallery
- Themes Gallery
- Data Stories Gallery
- R Script Showcase
- Webinars and Video Gallery
- Quick Measures Gallery
- 2021 MSBizAppsSummit Gallery
- 2020 MSBizAppsSummit Gallery
- 2019 MSBizAppsSummit Gallery
- Events
- Ideas
- Custom Visuals Ideas
- Issues
- Issues
- Events
- Upcoming Events
- Community Blog
- Power BI Community Blog
- Custom Visuals Community Blog
- Community Support
- Community Accounts & Registration
- Using the Community
- Community Feedback
Register now to learn Fabric in free live sessions led by the best Microsoft experts. From Apr 16 to May 9, in English and Spanish.
- Power BI forums
- Forums
- Get Help with Power BI
- DAX Commands and Tips
- Forecast for future periods using previous forecas...
- Subscribe to RSS Feed
- Mark Topic as New
- Mark Topic as Read
- Float this Topic for Current User
- Bookmark
- Subscribe
- Printer Friendly Page
- Mark as New
- Bookmark
- Subscribe
- Mute
- Subscribe to RSS Feed
- Permalink
- Report Inappropriate Content
Forecast for future periods using previous forecast
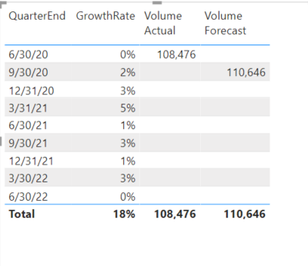
I have two tables. One table has actual sales data and one table has the growth rates and is where I'm trying to derive the forecast. I've aggregated both to the quarter level. In the below picture the 'Volume Actual' is the data from the actual sales table. I would like to take the 'Volume Actual' from the 6/30/20 quarter end and apply the growth rate from the 9/30/20 quarter end and have a running 'Volume Forecast' in which the prior quarter's number is used and the growth rate is applied.
For example, for 12/31/20 'Volume Forecast', I would like to take the 110,646 figure from the 9/30/20 quarter ending and multiply it by the 3% growth rate for the 12/31/20 quarter and so on all the way through 6/30/22.
Thank you for the help.
- Mark as New
- Bookmark
- Subscribe
- Mute
- Subscribe to RSS Feed
- Permalink
- Report Inappropriate Content
Best
D
- Mark as New
- Bookmark
- Subscribe
- Mute
- Subscribe to RSS Feed
- Permalink
- Report Inappropriate Content
@Anonymous
The growth rate will always be quarterly. No need to get more granular. Below is a table with my ideal scenario. Thank you for the help.
| QuarterEnd | GrowthRate | VolumeActual | VolumeBaseline (Forecast) |
| 6/30/2020 | 0% | 113,850 | |
| 9/30/2020 | 2% | 116,127 | |
| 12/31/2020 | 3% | 119,611 | |
| 3/31/2021 | 5% | 125,591 | |
| 6/30/2021 | 1% | 126,847 | |
| 9/30/2021 | 3% | 130,653 | |
| 12/31/2021 | 1% | 131,959 | |
| 3/30/2022 | 3% | 135,918 | |
| 6/30/2022 | 0% | 135,918 |
- Mark as New
- Bookmark
- Subscribe
- Mute
- Subscribe to RSS Feed
- Permalink
- Report Inappropriate Content
Use productx. Here's the pseudo code
Volume Forecast = productx(1+[Growth rate]) * 108476
Post the sample data in a table if you want the actual formula.
- Mark as New
- Bookmark
- Subscribe
- Mute
- Subscribe to RSS Feed
- Permalink
- Report Inappropriate Content
The below is what I would want in table format. Thank you for your help.
| QuarterEnd | GrowthRate | VolumeActual | VolumeBaseline (Forecast) |
| 6/30/2020 | 0% | 113,850 | |
| 9/30/2020 | 2% | 116,127 | |
| 12/31/2020 | 3% | 119,611 | |
| 3/31/2021 | 5% | 125,591 | |
| 6/30/2021 | 1% | 126,847 | |
| 9/30/2021 | 3% | 130,653 | |
| 12/31/2021 | 1% | 131,959 | |
| 3/30/2022 | 3% | 135,918 | |
| 6/30/2022 | 0% | 135,918 |
Helpful resources

Microsoft Fabric Learn Together
Covering the world! 9:00-10:30 AM Sydney, 4:00-5:30 PM CET (Paris/Berlin), 7:00-8:30 PM Mexico City

Power BI Monthly Update - April 2024
Check out the April 2024 Power BI update to learn about new features.

| User | Count |
|---|---|
| 40 | |
| 20 | |
| 19 | |
| 15 | |
| 15 |
| User | Count |
|---|---|
| 47 | |
| 28 | |
| 25 | |
| 17 | |
| 17 |

