- Power BI forums
- Updates
- News & Announcements
- Get Help with Power BI
- Desktop
- Service
- Report Server
- Power Query
- Mobile Apps
- Developer
- DAX Commands and Tips
- Custom Visuals Development Discussion
- Health and Life Sciences
- Power BI Spanish forums
- Translated Spanish Desktop
- Power Platform Integration - Better Together!
- Power Platform Integrations (Read-only)
- Power Platform and Dynamics 365 Integrations (Read-only)
- Training and Consulting
- Instructor Led Training
- Dashboard in a Day for Women, by Women
- Galleries
- Community Connections & How-To Videos
- COVID-19 Data Stories Gallery
- Themes Gallery
- Data Stories Gallery
- R Script Showcase
- Webinars and Video Gallery
- Quick Measures Gallery
- 2021 MSBizAppsSummit Gallery
- 2020 MSBizAppsSummit Gallery
- 2019 MSBizAppsSummit Gallery
- Events
- Ideas
- Custom Visuals Ideas
- Issues
- Issues
- Events
- Upcoming Events
- Community Blog
- Power BI Community Blog
- Custom Visuals Community Blog
- Community Support
- Community Accounts & Registration
- Using the Community
- Community Feedback
Register now to learn Fabric in free live sessions led by the best Microsoft experts. From Apr 16 to May 9, in English and Spanish.
- Power BI forums
- Forums
- Get Help with Power BI
- DAX Commands and Tips
- Re: Customer Repurchase Cycle
- Subscribe to RSS Feed
- Mark Topic as New
- Mark Topic as Read
- Float this Topic for Current User
- Bookmark
- Subscribe
- Printer Friendly Page
- Mark as New
- Bookmark
- Subscribe
- Mute
- Subscribe to RSS Feed
- Permalink
- Report Inappropriate Content
Customer Repurchase Cycle
Hi Community and PowerBi Masters,
I am currently working on an analysis for which I try to understand the consumer behavior in detail.
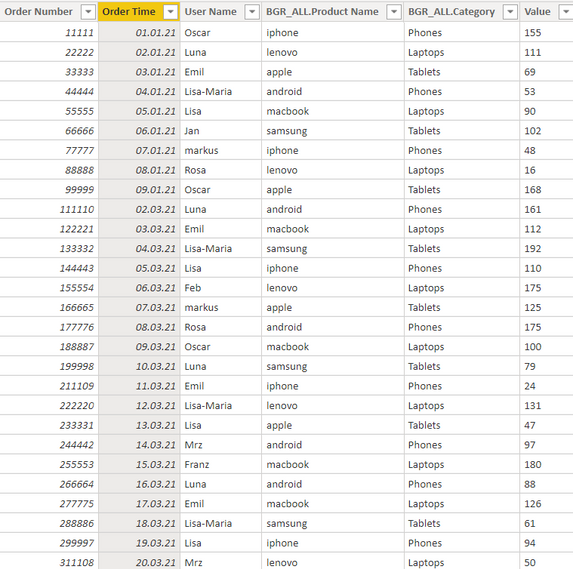
The corresponding data that I have is (name of table: All_Platforms):
-Order Number
-Order Time
-User Name
-BGR_ALL.Product Name
-BGR_ALL.Category
There are a couple of things I want to understand and differentiate.
1.Variable needed in new column: differentiate between new and old customers
(based on User Name: is it a customer that purchased for the first time or does reouccuring purchases)
2. Understand on product and category level, when a specific customer has purchased an item again.
- frequency:
how often did he repurchase within certain time frame?
-time difference: (product and category level)
how long does it take to be repurchased by consumers?
I hope that is clear. Let me know if you need any more informatoin to solve my issue!
Highly appreciate your help.
All the best and many thanks!
Solved! Go to Solution.
- Mark as New
- Bookmark
- Subscribe
- Mute
- Subscribe to RSS Feed
- Permalink
- Report Inappropriate Content
@Jannnn04 Hi, considering your issues I made measures as below. I hope this helps you.
//[NumOfTotPurchase]: This counts all purchases even if order numbers are the same. e.g. if Emil purchased 4 macbooks on the same day under same oerder number, it still counts 4.
- Mark as New
- Bookmark
- Subscribe
- Mute
- Subscribe to RSS Feed
- Permalink
- Report Inappropriate Content
@Jannnn04 Hi,
The answer to Q1 is as I explained in eariler message:
Calculated Column:

The answer to Q2-2: how long does it take to be repurchased by consumers?
If you are looking for average number of date for a customer to repurchase item,
I guess what you need are
1. The time difference between Last purchase date and First purchase date
2. Total number of purchase.
3. the answer would be DIVIDE(The time difference, Total number of purchase)
Below is the measure to calculate it.
I selected time period of 2021.2.4~2021.3.17.

I hope this helps you. If you like my answer, please select my post as the Solution along with Kudo.
Thanks
- Mark as New
- Bookmark
- Subscribe
- Mute
- Subscribe to RSS Feed
- Permalink
- Report Inappropriate Content
Hi Colacan,
thank you so much for your answer! It already helps a lot! 🙂
Some comments:
- For the first question to differentiate between new and old: it works perfectly, thanks.
- For the second question (Q2-1Amount of purchases): the countrows function results in aggregating all rows but does not filter for the specific user's amount of purchases for category or product level.
- For the third question (Q2-2; time diff. between purchases): the function itself works but results in empty cells/an empty column.
Can you maybe help me with that issues?
Thank you! 🙂
- Mark as New
- Bookmark
- Subscribe
- Mute
- Subscribe to RSS Feed
- Permalink
- Report Inappropriate Content
@Jannnn04 Hi, Jannnn04,
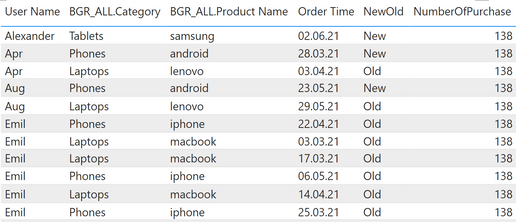
Q2-1 : Pllease double check the formular
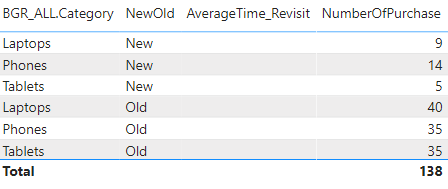
it's NumberOfPurchase = countrows(All_Platforms) not countrows(All(All_Platforms))
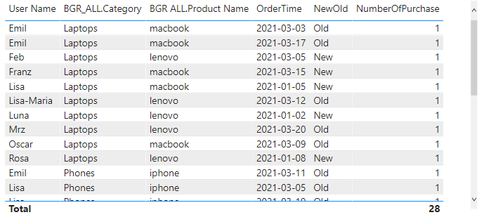
In above table table, the value should be 1 for each row not 138.
Let me explain a bit here why the number should be 1 and this explanation is also realted to the answer to your Q2-2.
In above table, you have added all the columns, which means you have added all the conditions to get the number of Purchase under all these conditions.
Your question to power BI for the first row is:
"Show me how many items Emil bought Latop which is macbook on 3rd March 2021". of cuase the answer would be 1 because your question is too specific.
However if you change the question with less conditions by removing some columns,
""Show me how many items Emil bought Latop" then the answer would be 2 as below
The answer to Q2-2 will be the same. since you have put all the conditions in the table above, there are only unique and very specific cases. and there is no way to calculate time diffrence for 1 case. (at least 2 purchases are quired to calculate time difference)
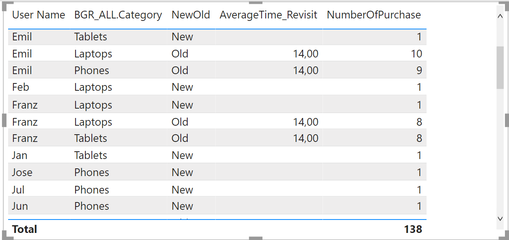
but if you reduce conditions (reduce columns of the table), like
"How frequently Emil buy item?" ==> total 4 times and on average 24.3 days took for each purchase
OR "how frequently Emil bought macbook" ==> 14 days, and so on.
I hope it clariied your concern.
Thanks
- Mark as New
- Bookmark
- Subscribe
- Mute
- Subscribe to RSS Feed
- Permalink
- Report Inappropriate Content
Good Morning Colacan!
thanks again for your help 🙂
Q2-1: I think I have found the core of the problem. I was creating columns instead of measures before (why is that so?). Now that I used measures with the formulars that you kindly provided, it almost perfectly works. There is just a small hick up, which I'd like to understand/circumvent.
Issue1:
The table now shows the correct values! Thank you at that stage already.
However, if I include the exact dates for which Emil purchased something, the average time between purchases disappears. Is there a way to keep the variable visible in the table for each day?
Issue2:
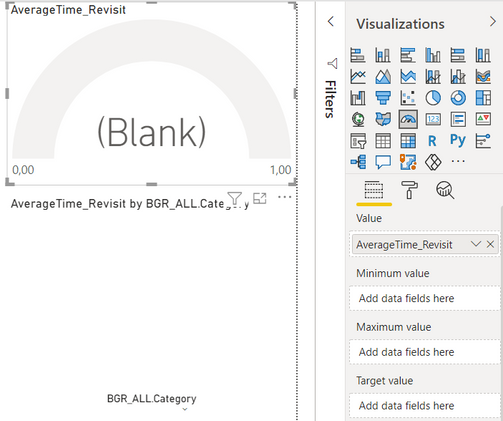
Also, I can not use the measure in a visualization really. Since it, as you described, always calculates a difference between two values, I can not depict the average repurchase time in a KPI card, in a gauge or in a bar chart - which was the goal. Would you know how to adjust that I would be able to display that?
Similarly, when displaying in a table, I would want to show the average time between purchases of categories/products excluding the users - so averaging on total category level. How would that work?
Best regards and many thanks!
- Mark as New
- Bookmark
- Subscribe
- Mute
- Subscribe to RSS Feed
- Permalink
- Report Inappropriate Content
@Jannnn04 Hi, Jannnn04
1. I was creating columns instead of measures before (why is that so?).
Calculate column evaluates each expression under row context. and filter context does not exist in calculate column.
COUNTROWS function, like SUM( ) or AVERAGE( ), conducts it's calculation under Filter context. since there is no filter context in calculate column, it calculates over entire table. that's why you got total number.
But measure is different. both CALCULATE and CALCULATETALBE invoke Context Transition which means, these two function change Row context to Filter context (in other words, context transition makes the 1 row as it's filter). one important thing is that all measures are wrapped by CALCULATE function inside the engine regardless you used calculate function for your measure or not. Therefore, if you create a measure, it will colcuate for the current row only.
Having say that, to create a column with the same result, you can simply wap the expression with CALCULATE as below.
Measure: NumberOfPurchase = countrows(All_Platforms)
Calculated column: NumberOfPurchase = CALCULATE(countrows(All_Platforms))
1. Average time with specific time:
As I expalined previously, to calculate average time, you need at lease two transactions because the average time is the Time Gap between 2 transactions.
If you want to show the earler time and the average time in the same row in the report, you need to create a table for it.
2. I can not depict the average repurchase time in a KPI card, in a gauge or in a bar chart
The measure (average time) needs customer as it's filter context because we cannot define re-purchase without "WHO" but the gauge does not have customer filter unless you select specific "customer" from outter filter. (e.g. selecting "Emil" with slicer).
If you want to show overall "avg. revisiting time" regardless customer (which means average of revisiting time for all customers who purchased item at least twice), then it will be another measure which can be combined with eailer one (the indivisual average time).
In that case, the 2 measures can be combined as below:
IF indivisual is selected, return the value from eailer measure,
else return value from new measure.
(By the way, those customer who purchase only once shoule be excluded for the new measure.)
I hope you can handle your issues with above guideline. I may make the code when I find time but not sure when.
so If you are looking for the solution urgently, please find help from others.
Thanks.
- Mark as New
- Bookmark
- Subscribe
- Mute
- Subscribe to RSS Feed
- Permalink
- Report Inappropriate Content
Hello @colacan,
wow, thanks a lot, again. The explanations are really, really helpful! 🙂
I tried to create the code myself but so far I got stuck with both issue 1 and 2. Would be great if you can help me with that again. Really brilliant from you, thanks!
I am super sorry to further bother but I discovered another problem.
Issue
I now edited the data and have for one specific day, with one order number, many purchases from one customer (emil) for one product (macbook in category laptop). That decreased the the average time between purchases from that user. However, the real average time between purchases has not changed. He just purchased more items within one order.
How can I change the code to treat a single, large order (with one order number) as a single transaction?
Obviosuly also happy if anyone else would want to assist colacan with his great work so far:)
Thanks a lot and best regards!
Jan
- Mark as New
- Bookmark
- Subscribe
- Mute
- Subscribe to RSS Feed
- Permalink
- Report Inappropriate Content
I still did not manage to solve that issue and would be super grateful if someone can assist! 🙂
Thanks, community!
- Mark as New
- Bookmark
- Subscribe
- Mute
- Subscribe to RSS Feed
- Permalink
- Report Inappropriate Content
@Jannnn04 Hi, considering your issues I made measures as below. I hope this helps you.
//[NumOfTotPurchase]: This counts all purchases even if order numbers are the same. e.g. if Emil purchased 4 macbooks on the same day under same oerder number, it still counts 4.
- Mark as New
- Bookmark
- Subscribe
- Mute
- Subscribe to RSS Feed
- Permalink
- Report Inappropriate Content
Hi Jannnn04,
If you post your question one by one along with sample data, it would be easyer to answer. the question itself doesn't look that complicated but the answer would be quite broad without data. Thanks.
- Mark as New
- Bookmark
- Subscribe
- Mute
- Subscribe to RSS Feed
- Permalink
- Report Inappropriate Content
Hi Colacan,
thank you for your quick response.
I will upload sample data and post the questions individually --> Updated the original post.
- Mark as New
- Bookmark
- Subscribe
- Mute
- Subscribe to RSS Feed
- Permalink
- Report Inappropriate Content
Hi Jannnn04,
For the first question, you can try calculate column as below;
Helpful resources

Microsoft Fabric Learn Together
Covering the world! 9:00-10:30 AM Sydney, 4:00-5:30 PM CET (Paris/Berlin), 7:00-8:30 PM Mexico City

Power BI Monthly Update - April 2024
Check out the April 2024 Power BI update to learn about new features.

| User | Count |
|---|---|
| 39 | |
| 21 | |
| 21 | |
| 14 | |
| 13 |
| User | Count |
|---|---|
| 45 | |
| 31 | |
| 30 | |
| 18 | |
| 17 |
