- Power BI forums
- Updates
- News & Announcements
- Get Help with Power BI
- Desktop
- Service
- Report Server
- Power Query
- Mobile Apps
- Developer
- DAX Commands and Tips
- Custom Visuals Development Discussion
- Health and Life Sciences
- Power BI Spanish forums
- Translated Spanish Desktop
- Power Platform Integration - Better Together!
- Power Platform Integrations (Read-only)
- Power Platform and Dynamics 365 Integrations (Read-only)
- Training and Consulting
- Instructor Led Training
- Dashboard in a Day for Women, by Women
- Galleries
- Community Connections & How-To Videos
- COVID-19 Data Stories Gallery
- Themes Gallery
- Data Stories Gallery
- R Script Showcase
- Webinars and Video Gallery
- Quick Measures Gallery
- 2021 MSBizAppsSummit Gallery
- 2020 MSBizAppsSummit Gallery
- 2019 MSBizAppsSummit Gallery
- Events
- Ideas
- Custom Visuals Ideas
- Issues
- Issues
- Events
- Upcoming Events
- Community Blog
- Power BI Community Blog
- Custom Visuals Community Blog
- Community Support
- Community Accounts & Registration
- Using the Community
- Community Feedback
Register now to learn Fabric in free live sessions led by the best Microsoft experts. From Apr 16 to May 9, in English and Spanish.
- Power BI forums
- Forums
- Get Help with Power BI
- DAX Commands and Tips
- Cumulative total filtering only the max item in a ...
- Subscribe to RSS Feed
- Mark Topic as New
- Mark Topic as Read
- Float this Topic for Current User
- Bookmark
- Subscribe
- Printer Friendly Page
- Mark as New
- Bookmark
- Subscribe
- Mute
- Subscribe to RSS Feed
- Permalink
- Report Inappropriate Content
Cumulative total filtering only the max item in a given date (backlog of requests per status)
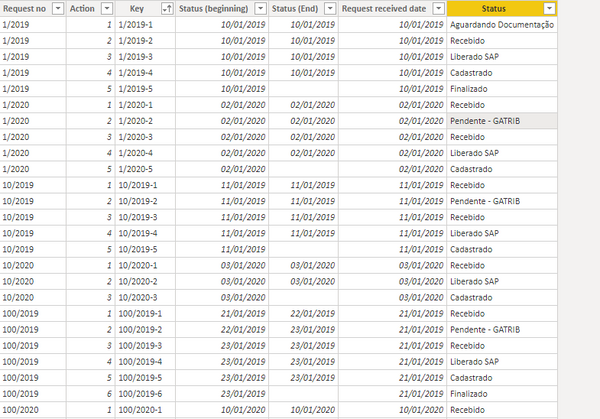
I got a table with the beginning and end date of each step/status throughout the lifetime of a request.
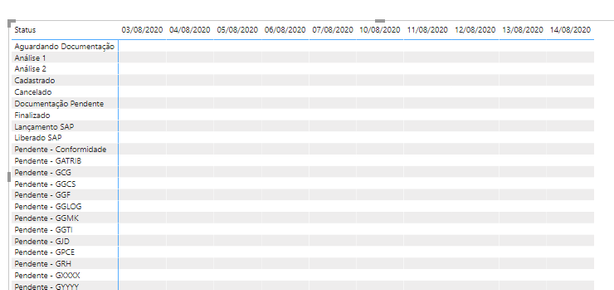
I'd like to create a matrix breaking down the pending requests by date and status, i.e.:
- columns: dates (from a DimDate table)
Rows: status
values: number of pending requests per status in that given date.
How can I calculate this?
Here is the link for pbix file on my OneDrive with the data, if it helps.
Link of pbix file on my OneDrive
Solved! Go to Solution.
- Mark as New
- Bookmark
- Subscribe
- Mute
- Subscribe to RSS Feed
- Permalink
- Report Inappropriate Content
The expression below doesn't match your numbers (not sure why), but I think it is the kind of approach that will get you there. I think it reproduces your SQL logic, but please confirm. For each Request No, it calculates both the action # for that status before the date and the overall max before that date for any status. It then counts the rows where those two values are equal (and not blank). Note this is a resource intensive calculation given your # of rows and dates, so I encourage you to add a YearMonth column and use it in your visual instead of having it at the day level (or some other way to reduce the # of calculations going on).
Requests 2 =
VAR thisdate =
    MAX ( DimCalendar[Date] )
VAR thisstatus =
    MIN ( 'When'[Status] )
VAR reqnos =
    CALCULATETABLE (
        VALUES ( 'When'[Request no] ),
        ALL ( DimCalendar ),
        'When'[Status (beginning)] <= thisdate
    )
VAR summary =
    ADDCOLUMNS (
        reqnos,
        "thisstatusaction",
            CALCULATE (
                MAX ( 'When'[Action] ),
                ALL ( DimCalendar ),
                'When'[Status (beginning)] <= thisdate
            ),
        "overallmax",
            CALCULATE (
                MAX ( 'When'[Action] ),
                ALL ( 'When'[Status] ),
                ALL ( DimCalendar ),
                'When'[Status (beginning)] <= thisdate
            )
    )
RETURN
    COUNTROWS (
        FILTER (
            summary,
            AND (
                [thisstatusaction] > 0,
                [thisstatusaction] = [overallmax]
            )
        )
    )
Regards,
Pat
Did I answer your question? Mark my post as a solution! Kudos are also appreciated!
To learn more about Power BI, follow me on Twitter or subscribe on YouTube.
@mahoneypa HoosierBI on YouTube
- Mark as New
- Bookmark
- Subscribe
- Mute
- Subscribe to RSS Feed
- Permalink
- Report Inappropriate Content
Please see this measure expression to get your desired results.
Requests =
VAR thisdate =
    MIN ( DimCalendar[Date] )
RETURN
    CALCULATE (
        DISTINCTCOUNT ( 'When'[Request no] ),
        FILTER (
            ALLEXCEPT (
                'When',
                'When'[Status]
            ),
            'When'[Status (beginning)] <= thisdate
                && 'When'[Status (End)] >= thisdate
        )
    )
Regards,
Pat
Did I answer your question? Mark my post as a solution! Kudos are also appreciated!
To learn more about Power BI, follow me on Twitter or subscribe on YouTube.
@mahoneypa HoosierBI on YouTube
- Mark as New
- Bookmark
- Subscribe
- Mute
- Subscribe to RSS Feed
- Permalink
- Report Inappropriate Content
@mahoneypat , thanks, I highly appreciate the support.
It didn't return quite what I expected.
I refreshed the report and compared to a real-time time view the source system provides.
I got this from Power BI report:
What I got from the source system for specific "statuses" and expect from my measure was:
| 30/09/2020 | |
| Análise 1 - GCAD | 27 |
| Análise 2 - GCAD | 29 |
| Liberado SAP | 32 |
| Lançamento SAP | 102 |
Here is the link for the refreshed PBI highlighting the result of the suggested measure for this specific date point:
- Mark as New
- Bookmark
- Subscribe
- Mute
- Subscribe to RSS Feed
- Permalink
- Report Inappropriate Content
I looked at your refreshed pbix in Data View and filtered the data to check one of the Status values. I checked Analise 1- GCAD and filtered to those rows where the beginning status was <= Sep 30 and the end status was >= Sep 30. Is that the correct logic? If so, so, there are 21 rows returned (19 distinct rows ); see counts at bottom of the pic. Please let me know what the correct logic is, if not this approach, and the measure can be adapted.
Regards,
Pat
Did I answer your question? Mark my post as a solution! Kudos are also appreciated!
To learn more about Power BI, follow me on Twitter or subscribe on YouTube.
@mahoneypa HoosierBI on YouTube
- Mark as New
- Bookmark
- Subscribe
- Mute
- Subscribe to RSS Feed
- Permalink
- Report Inappropriate Content
@mahoneypat thanks, again. Sorry for taking so long to reply.
I believe the logic for what I need (number of requests in a specific status on a specific date) can be achieved by:
1) Filtering status (beginning) <= 30/09/2020
2) Getting only the records where index = max for the given request
3) Grouping that by status counting the number of rows
I could run a SQL query successfully with this logic
SELECT status, COUNT(*) FROM dataset d
INNER JOIN(SELECT MAX(ind) ind, request_no
		   FROM dataset
		   WHERE datebeg <= '2020-09-30'
		   GROUP BY request_no
		  ) maxreq
ON d.request_no = maxreq.request_no AND d.ind = maxreq.ind
GROUP BY status- Mark as New
- Bookmark
- Subscribe
- Mute
- Subscribe to RSS Feed
- Permalink
- Report Inappropriate Content
The expression below doesn't match your numbers (not sure why), but I think it is the kind of approach that will get you there. I think it reproduces your SQL logic, but please confirm. For each Request No, it calculates both the action # for that status before the date and the overall max before that date for any status. It then counts the rows where those two values are equal (and not blank). Note this is a resource intensive calculation given your # of rows and dates, so I encourage you to add a YearMonth column and use it in your visual instead of having it at the day level (or some other way to reduce the # of calculations going on).
Requests 2 =
VAR thisdate =
    MAX ( DimCalendar[Date] )
VAR thisstatus =
    MIN ( 'When'[Status] )
VAR reqnos =
    CALCULATETABLE (
        VALUES ( 'When'[Request no] ),
        ALL ( DimCalendar ),
        'When'[Status (beginning)] <= thisdate
    )
VAR summary =
    ADDCOLUMNS (
        reqnos,
        "thisstatusaction",
            CALCULATE (
                MAX ( 'When'[Action] ),
                ALL ( DimCalendar ),
                'When'[Status (beginning)] <= thisdate
            ),
        "overallmax",
            CALCULATE (
                MAX ( 'When'[Action] ),
                ALL ( 'When'[Status] ),
                ALL ( DimCalendar ),
                'When'[Status (beginning)] <= thisdate
            )
    )
RETURN
    COUNTROWS (
        FILTER (
            summary,
            AND (
                [thisstatusaction] > 0,
                [thisstatusaction] = [overallmax]
            )
        )
    )
Regards,
Pat
Did I answer your question? Mark my post as a solution! Kudos are also appreciated!
To learn more about Power BI, follow me on Twitter or subscribe on YouTube.
@mahoneypa HoosierBI on YouTube
- Mark as New
- Bookmark
- Subscribe
- Mute
- Subscribe to RSS Feed
- Permalink
- Report Inappropriate Content
It returned exactly what I needed now. Thanks a lot, @mahoneypat
The results didn't match because my numbers were taken from the source system some hours before my query against the database. I ran it today before anyone's access and saw the same numbers in the system view and on PBI.
Indeed it runs slowly compared to other measures but the purpose is seeing the daily evolution in a window of 2-3 weeks at most, so performance is fine.
Now I need to study more these commands I don't know very well: "ADDCOLUMNS" along with "CACULATETABLE".
Helpful resources

Microsoft Fabric Learn Together
Covering the world! 9:00-10:30 AM Sydney, 4:00-5:30 PM CET (Paris/Berlin), 7:00-8:30 PM Mexico City

Power BI Monthly Update - April 2024
Check out the April 2024 Power BI update to learn about new features.

| User | Count |
|---|---|
| 47 | |
| 26 | |
| 19 | |
| 14 | |
| 10 |
| User | Count |
|---|---|
| 57 | |
| 49 | |
| 44 | |
| 18 | |
| 18 |


