- Power BI forums
- Updates
- News & Announcements
- Get Help with Power BI
- Desktop
- Service
- Report Server
- Power Query
- Mobile Apps
- Developer
- DAX Commands and Tips
- Custom Visuals Development Discussion
- Health and Life Sciences
- Power BI Spanish forums
- Translated Spanish Desktop
- Power Platform Integration - Better Together!
- Power Platform Integrations (Read-only)
- Power Platform and Dynamics 365 Integrations (Read-only)
- Training and Consulting
- Instructor Led Training
- Dashboard in a Day for Women, by Women
- Galleries
- Community Connections & How-To Videos
- COVID-19 Data Stories Gallery
- Themes Gallery
- Data Stories Gallery
- R Script Showcase
- Webinars and Video Gallery
- Quick Measures Gallery
- 2021 MSBizAppsSummit Gallery
- 2020 MSBizAppsSummit Gallery
- 2019 MSBizAppsSummit Gallery
- Events
- Ideas
- Custom Visuals Ideas
- Issues
- Issues
- Events
- Upcoming Events
- Community Blog
- Power BI Community Blog
- Custom Visuals Community Blog
- Community Support
- Community Accounts & Registration
- Using the Community
- Community Feedback
Register now to learn Fabric in free live sessions led by the best Microsoft experts. From Apr 16 to May 9, in English and Spanish.
- Power BI forums
- Forums
- Get Help with Power BI
- DAX Commands and Tips
- Re: Cumulative monthly target with filtered dates
- Subscribe to RSS Feed
- Mark Topic as New
- Mark Topic as Read
- Float this Topic for Current User
- Bookmark
- Subscribe
- Printer Friendly Page
- Mark as New
- Bookmark
- Subscribe
- Mute
- Subscribe to RSS Feed
- Permalink
- Report Inappropriate Content
Cumulative monthly target with filtered dates
Hello everyone,
I am quite new to PowerBI and would very much appreciate your help on something I have been stuck on for a few days now.
I have an order table (let's call it "Orders") with a transaction date, the assigned contract for that order, as well as the start and end dates of that contract.
I have another table ("Contracts") with the contract name and the orders limit for that contract (a limit of 29, for example, means that I can only place 29 orders against that contract throughout its whole duration).
These two tables have a many-to-one relationship from the Orders table to the Contracts table, based on the contract name.
I have a slicer that allows the user to select a contract and a year, and see all orders information for this contract during that year.
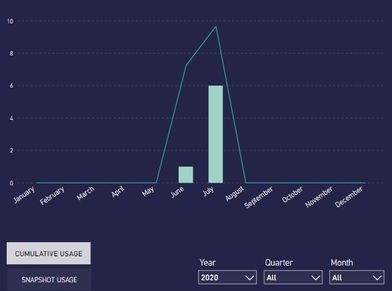
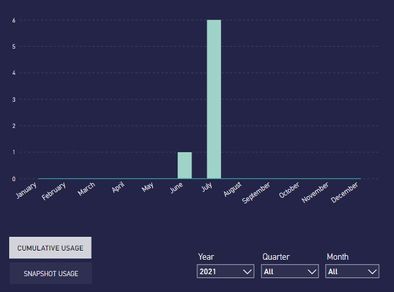
This slicer "controls" a chart that shows, for each month where there were orders against the selected contract during the selected year, the cumulative number of orders. I linked the table to a "Months1" table listing all 12 months names (by creating a "Transaction Month" calculated column in the Orders table and using it as the common column), and then used these months as the X-Axis, so that even months with no order data are shown.
So far, so good:
Note: There was 1 order in June and 5 in July, so the cumulative quantity in July is indeed 6.
Now, however, I would like to add a line to that same chart that shows the cumulative order limit of the contract. If the contract starts in April 2020 and ends in March 2021, for example, and has a limit of 29, I would like to create a line in the 2020 chart that starts at 2.42 in April (29/12 months), and reaches 21.75 in December. In the 2021 chart, it would start at 24.17 in January and reach its end (29) in March. This would enable users to evaluate their cumulative monthly consumption against the limit.
I have played around a bit and created a "MonthsYear" table that uses the filters applied to the Orders table (namely the contract) and shows the cumulative monthly limit during the contract's duration:

But now, if I try to merge these two charts (the Orders column chart and the Target line chart) by linking them both to the same "Months" table, I get the following:
I see 3 issues:
- It seems like when there is no order data, the cumulative target values are also assumed to be 0 (whereas they looked just fine when the order data was not included).
- The chart does not recognize the transaction year of an order (the June and July order info should be shown for 2020 only).
- The "Year" filter also suggests Years where there is no value:
I would like to only see the years where there are values - in other words, the years between the contract start and end dates.
I guess this is all a problem of filtering within my queries, but I cannot seem to figure out where the error could be...
Your help would be very much appreciated!
Please let me know if anything was unclear, or if you need any more information to support me.
Many thanks in advance!
IJ.
- Mark as New
- Bookmark
- Subscribe
- Mute
- Subscribe to RSS Feed
- Permalink
- Report Inappropriate Content
@inesj Do you have a proper dimDate table? Or just MonthYear tables? You need a DimDate table, then create the measure based on that and connect all data to that single data table. Use the Date table in all slicers and in the axis for the visual. https://excelwithallison.blogspot.com/2020/04/dimdate-what-why-and-how.html
Please @mention me in your reply if you want a response.
Copying DAX from this post? Click here for a hack to quickly replace it with your own table names
Has this post solved your problem? Please Accept as Solution so that others can find it quickly and to let the community know your problem has been solved.
If you found this post helpful, please give Kudos C
I work as a Microsoft trainer and consultant, specialising in Power BI and Power Query.
www.excelwithallison.com
- Mark as New
- Bookmark
- Subscribe
- Mute
- Subscribe to RSS Feed
- Permalink
- Report Inappropriate Content
Hello Allison,
Many thanks for your quick reply.
I have created a DimDate table and based my measures on it, but unfortunately it is still not working.
Everything starts well, but "breaks" as soon as I connect my DimTable to my Orders table. I have created a Matrix to show you the behaviors:
Before the relationship is created:
After the relationship is created:
It really looks like there is something wrong with my CumulMonthlyTarget measure, which seems to disregard all the months with no "CumulativePartsUsage" (cumulative Orders) data.
The measure is the following:
Do you maybe have an idea?
Helpful resources

Microsoft Fabric Learn Together
Covering the world! 9:00-10:30 AM Sydney, 4:00-5:30 PM CET (Paris/Berlin), 7:00-8:30 PM Mexico City

Power BI Monthly Update - April 2024
Check out the April 2024 Power BI update to learn about new features.

| User | Count |
|---|---|
| 47 | |
| 22 | |
| 20 | |
| 15 | |
| 13 |
| User | Count |
|---|---|
| 49 | |
| 41 | |
| 39 | |
| 19 | |
| 19 |


