- Power BI forums
- Updates
- News & Announcements
- Get Help with Power BI
- Desktop
- Service
- Report Server
- Power Query
- Mobile Apps
- Developer
- DAX Commands and Tips
- Custom Visuals Development Discussion
- Health and Life Sciences
- Power BI Spanish forums
- Translated Spanish Desktop
- Power Platform Integration - Better Together!
- Power Platform Integrations (Read-only)
- Power Platform and Dynamics 365 Integrations (Read-only)
- Training and Consulting
- Instructor Led Training
- Dashboard in a Day for Women, by Women
- Galleries
- Community Connections & How-To Videos
- COVID-19 Data Stories Gallery
- Themes Gallery
- Data Stories Gallery
- R Script Showcase
- Webinars and Video Gallery
- Quick Measures Gallery
- 2021 MSBizAppsSummit Gallery
- 2020 MSBizAppsSummit Gallery
- 2019 MSBizAppsSummit Gallery
- Events
- Ideas
- Custom Visuals Ideas
- Issues
- Issues
- Events
- Upcoming Events
- Community Blog
- Power BI Community Blog
- Custom Visuals Community Blog
- Community Support
- Community Accounts & Registration
- Using the Community
- Community Feedback
Register now to learn Fabric in free live sessions led by the best Microsoft experts. From Apr 16 to May 9, in English and Spanish.
- Power BI forums
- Forums
- Get Help with Power BI
- DAX Commands and Tips
- Cumulative ascending repeat with change in column
- Subscribe to RSS Feed
- Mark Topic as New
- Mark Topic as Read
- Float this Topic for Current User
- Bookmark
- Subscribe
- Printer Friendly Page
- Mark as New
- Bookmark
- Subscribe
- Mute
- Subscribe to RSS Feed
- Permalink
- Report Inappropriate Content
Cumulative ascending repeat with change in column
Hi,
I don't know how to create an formula in PowerBI that makes ascending cumulatives that repeats with every change in column "Name".
Example: (Als = IF function)

In this example is the calculated column "cumulative visitors".
This shows that "Ans" had 7 visitors in total on 5-9-2019 (4+3). The cumulative numbers has to start with every change in name.
I have tried;

But this gives only the total cumulative number for a name. The same result as for column "SomAls" with calculation:
SomAls = CALCULATE(SUM(Blad1[Aantal bezoekers]);ALLEXCEPT(BLAD1;Blad1[Naam])).
So this doesn't give the right numbers that i want.
I have no idea how i can create the same calculated column in PowerBI.
I hope someone knows how i can do this.
Thanks in advance!
Solved! Go to Solution.
- Mark as New
- Bookmark
- Subscribe
- Mute
- Subscribe to RSS Feed
- Permalink
- Report Inappropriate Content
Hi,

Regards,
- Mark as New
- Bookmark
- Subscribe
- Mute
- Subscribe to RSS Feed
- Permalink
- Report Inappropriate Content
Use the below Formula.
- Mark as New
- Bookmark
- Subscribe
- Mute
- Subscribe to RSS Feed
- Permalink
- Report Inappropriate Content
@deepu2108 wrote:Use the below Formula.
CumSum = CALCULATE(SUM('Table'[Total Visitors]),ALLEXCEPT('Table','Table'[Name]),FILTER('Table','Table'[Name]<=EARLIER('Table'[Name]) && 'Table'[Date]<=EARLIER('Table'[Date])))
Hi, Thanks for your reply!
I have tried the DAX that you have given me but I still get the wrong numbers:

In the first range it starts goed but from "Jan" it goes wrong. The numbers has to be the same as in column "Cumulative visitors".
Can you please help me again with this? 🙂
- Mark as New
- Bookmark
- Subscribe
- Mute
- Subscribe to RSS Feed
- Permalink
- Report Inappropriate Content
see my reply below
Did this post answer your question? Mark it as a solution so others can find it!
Help when you know. Ask when you don't!
Join the conversation at We Talk BI find out more about me at Slow BI
- Mark as New
- Bookmark
- Subscribe
- Mute
- Subscribe to RSS Feed
- Permalink
- Report Inappropriate Content
Pardon, I think I identified the wrong pattern in my previous post. Here is some sample code from an online article
A similar technique can show running totals over different attributes and dimensions. In the demo database, customers are clustered into different categories, based on purchase volume: Platinum, Gold and Silver. What if the user wants a running total of sales amounts for their top tier customers, starting at the top with the Platinum category? The running total pattern is a useful technique here, too.
The goal is to obtain the following report: :
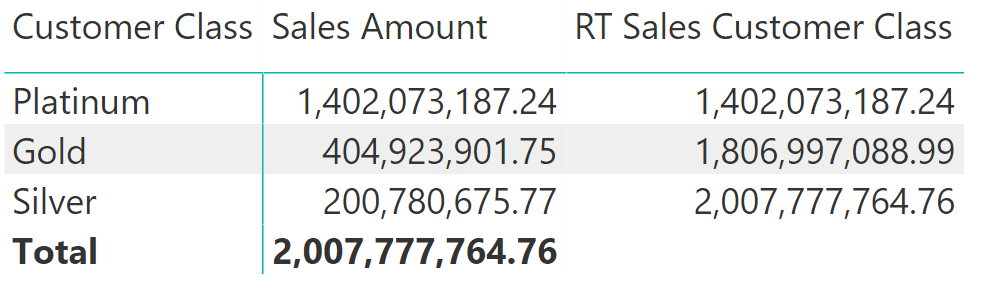
The DAX code for RT Sales Customer Class uses the very same pattern as for the running total described earlier:
1 2 3 4 5 6 7 8 | RT Sales Customer Class := VAR CurrentCustomerClass = SELECTEDVALUE ( Customer[Customer Class Number] ) RETURN CALCULATE ( [Sales Amount], Customer[Customer Class Number] <= CurrentCustomerClass, ALL ( Customer[Customer Class] ) ) |
showing how to get a cumulative total for a value that changes (in this case "customer class"). The article provides a lot of examples and may help you see the trick you need to do
https://www.sqlbi.com/articles/computing-running-totals-in-dax/
Did this post answer your question? Mark it as a solution so others can find it!
Help when you know. Ask when you don't!
Join the conversation at We Talk BI find out more about me at Slow BI
- Mark as New
- Bookmark
- Subscribe
- Mute
- Subscribe to RSS Feed
- Permalink
- Report Inappropriate Content
Hi, Thanks for you reply!!
With this i only get cumulative totals but that is not what i mean. I want a column that shows all the cumulatives per row.
I hope you still want to help me with this 🙂
- Mark as New
- Bookmark
- Subscribe
- Mute
- Subscribe to RSS Feed
- Permalink
- Report Inappropriate Content
Hi,
Regards,
- Mark as New
- Bookmark
- Subscribe
- Mute
- Subscribe to RSS Feed
- Permalink
- Report Inappropriate Content
Many thanks!!! 🙂 this works, i'm very happy!
Helpful resources

Microsoft Fabric Learn Together
Covering the world! 9:00-10:30 AM Sydney, 4:00-5:30 PM CET (Paris/Berlin), 7:00-8:30 PM Mexico City

Power BI Monthly Update - April 2024
Check out the April 2024 Power BI update to learn about new features.

Fabric Community Update - April 2024
Find out what's new and trending in the Fabric Community.

| User | Count |
|---|---|
| 41 | |
| 21 | |
| 21 | |
| 14 | |
| 13 |
| User | Count |
|---|---|
| 43 | |
| 32 | |
| 30 | |
| 18 | |
| 18 |