- Power BI forums
- Updates
- News & Announcements
- Get Help with Power BI
- Desktop
- Service
- Report Server
- Power Query
- Mobile Apps
- Developer
- DAX Commands and Tips
- Custom Visuals Development Discussion
- Health and Life Sciences
- Power BI Spanish forums
- Translated Spanish Desktop
- Power Platform Integration - Better Together!
- Power Platform Integrations (Read-only)
- Power Platform and Dynamics 365 Integrations (Read-only)
- Training and Consulting
- Instructor Led Training
- Dashboard in a Day for Women, by Women
- Galleries
- Community Connections & How-To Videos
- COVID-19 Data Stories Gallery
- Themes Gallery
- Data Stories Gallery
- R Script Showcase
- Webinars and Video Gallery
- Quick Measures Gallery
- 2021 MSBizAppsSummit Gallery
- 2020 MSBizAppsSummit Gallery
- 2019 MSBizAppsSummit Gallery
- Events
- Ideas
- Custom Visuals Ideas
- Issues
- Issues
- Events
- Upcoming Events
- Community Blog
- Power BI Community Blog
- Custom Visuals Community Blog
- Community Support
- Community Accounts & Registration
- Using the Community
- Community Feedback
Register now to learn Fabric in free live sessions led by the best Microsoft experts. From Apr 16 to May 9, in English and Spanish.
- Power BI forums
- Forums
- Get Help with Power BI
- DAX Commands and Tips
- Re: Correlation between multiple columns in multip...
- Subscribe to RSS Feed
- Mark Topic as New
- Mark Topic as Read
- Float this Topic for Current User
- Bookmark
- Subscribe
- Printer Friendly Page
- Mark as New
- Bookmark
- Subscribe
- Mute
- Subscribe to RSS Feed
- Permalink
- Report Inappropriate Content
Correlation between multiple columns in multiple tables (3 types of calculation involved)
Hi all,
I need help with correlation table creation.
[Goal]
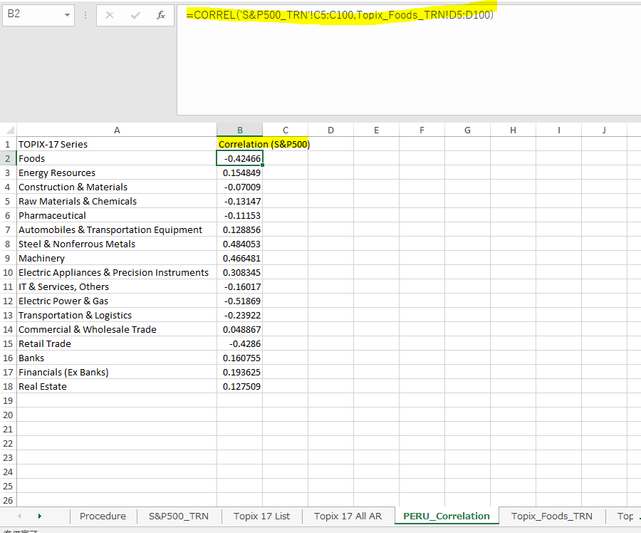
To create a correlation table like below to see the correlation (*3) between Active Return (*2) of Topix-17 Series and Monthly Return (*1) of several Indexes (trying with S&P500 to begin with).
As the data to be added regularly, I wish to do the calculation on Power BI instead of Excel.
Below is the output I made on Power BI with Excel calculated data.
X-Axis: Topix-17 Series
Y-Axis: Several Indexes (incl.S&P500)
[Indexes (Data)]
Columns and the number of rows are the same for every index (table), Total = 19 Indexes (tables)
- Topix-17 Series: 17 Indexes by industry categories. 17 historical month-end price tables.
- Topix Total Return Index
- S&P500 Total Return Index
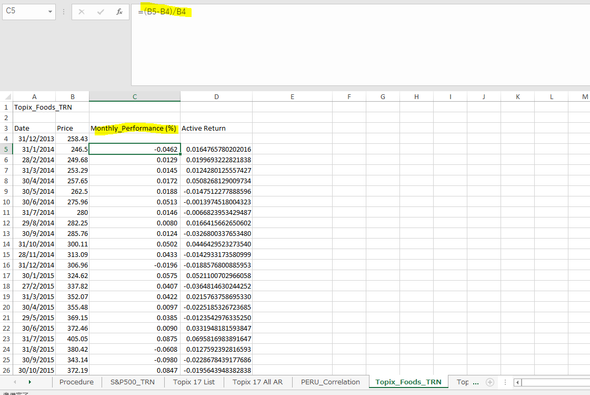
*1 Monthly Return = Monthly percentage change in ‘Price’
:Monthly return to be calculated for all the indexes (19 indexes)
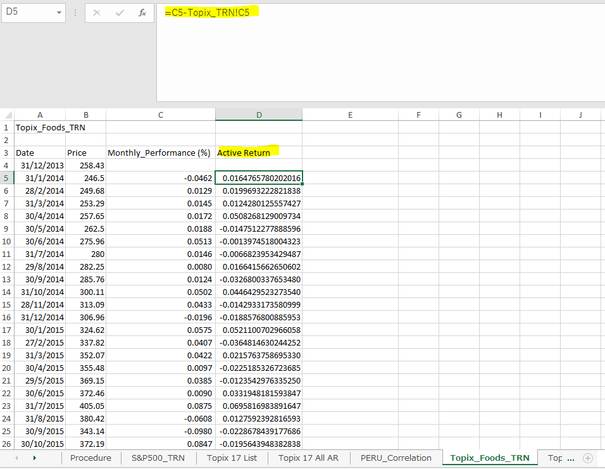
*2 Active Return = ‘Monthly Return of Each Topix-17 Index’ – ‘Monthly Return of Topix Total Return Index’
*3 Correlation: between ‘Active Return’ of each index of Topix-17 Series & ‘Monthly Return’ of S&P500 Total Return Index
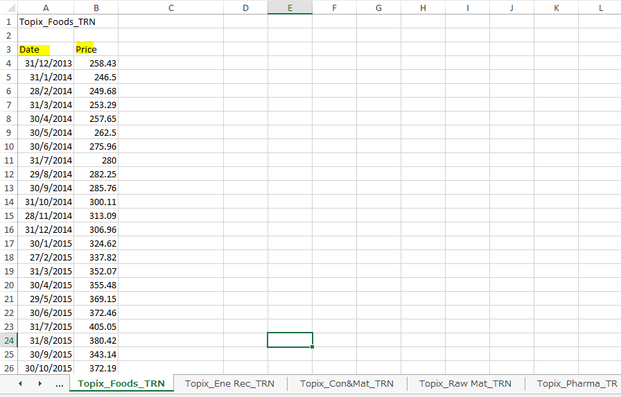
[Excel Calculation]
Hope this would explain the logics of calculations I would like to do on Power BI
Monthly Return:
Active Return:
Correlation:
[Methods Tried & Issues]
1. Inserting Index column to shift the Price value by one row
Issue: This method couldn’t put all 17 correlation values into one column, so the visual output cannot be how I want.
Solution required: If the correlation values could be calculated in one column, the output can be what I want.
2. Append the 17 tables (Topix-17 series) into a new table
(Creating a PreValue column by shifting the Prive value by one row)
Issue: Cannot shift the Price value by one row as the bottom row for each Index would calculate wrong
Solution required: if the Monthly return could be calculated without creating the PreValue column, this method may work
If anyone of you have ideas on the above, please tell me your ideas.
Thank you all in advance🙏
Peru
- Mark as New
- Bookmark
- Subscribe
- Mute
- Subscribe to RSS Feed
- Permalink
- Report Inappropriate Content
FYI, below is how the tables are interrelated
- Mark as New
- Bookmark
- Subscribe
- Mute
- Subscribe to RSS Feed
- Permalink
- Report Inappropriate Content
here is the updates on the progress
[Update of the Progress]
I am using the 2nd method I have mentioned (2. Append the 17 tables (Topix-17 series) into a new table), and the issue I have mentioned is solved.
Syntax for each colum is below:
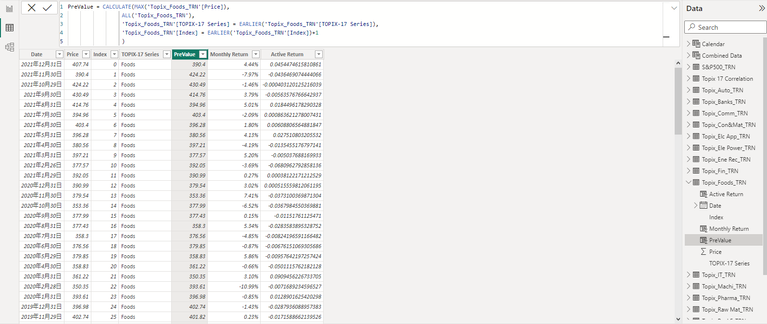
Column 'PreValue'
PreValue = CALCULATE(MAX('TOPIX-17 Series'[Price]),
                 ALL('TOPIX-17 Series'),
                 'TOPIX-17 Series'[Index Name] = EARLIER('TOPIX-17 Series'[Index Name]),
                 'TOPIX-17 Series'[Index] = EARLIER('TOPIX-17 Series'[Index])+1
                 )
Column 'Monthly Return'
Monthly Return = IF('TOPIX-17 Series'[PreValue] = BLANK(),
                   BLANK(),
                   ('TOPIX-17 Series'[Price]/'TOPIX-17 Series'[PreValue])-1)
Column 'Active Return'
Active Return = [Monthly Return] - RELATED('Topix_TRN'[Monthly Return])
How the table looks like:
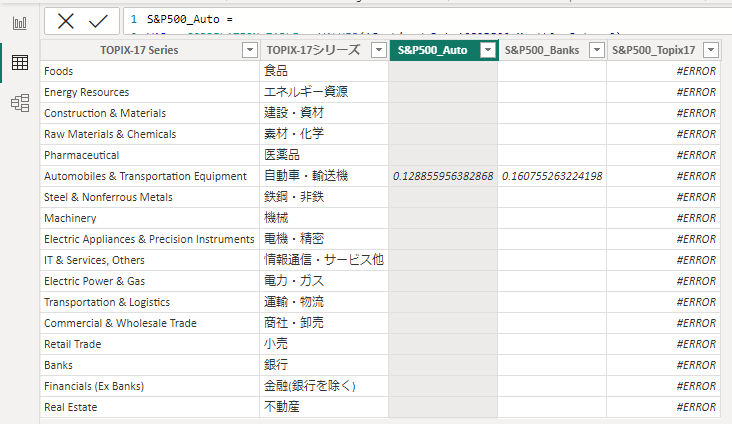
Column 'Correlation_S&P'
Correlation_S&P =
VAR __CORRELATION_TABLE = VALUES('TOPIX-17 Series'[Index Name])
VAR __COUNT =
	COUNTX(
		KEEPFILTERS(__CORRELATION_TABLE),
		CALCULATE(
			SUM('S&P500_TRN'[Monthly Return])
				* SUM('TOPIX-17 Series'[Active Return])
		)
	)
VAR __SUM_X =
	SUMX(
		KEEPFILTERS(__CORRELATION_TABLE),
		CALCULATE(SUM('S&P500_TRN'[Monthly Return]))
	)
VAR __SUM_Y =
	SUMX(
		KEEPFILTERS(__CORRELATION_TABLE),
		CALCULATE(SUM('TOPIX-17 Series'[Active Return]))
	)
VAR __SUM_XY =
	SUMX(
		KEEPFILTERS(__CORRELATION_TABLE),
		CALCULATE(
			SUM('S&P500_TRN'[Monthly Return])
				* SUM('TOPIX-17 Series'[Active Return]) * 1.
		)
	)
VAR __SUM_X2 =
	SUMX(
		KEEPFILTERS(__CORRELATION_TABLE),
		CALCULATE(SUM('S&P500_TRN'[Monthly Return]) ^ 2)
	)
VAR __SUM_Y2 =
	SUMX(
		KEEPFILTERS(__CORRELATION_TABLE),
		CALCULATE(SUM('TOPIX-17 Series'[Active Return]) ^ 2)
	)
RETURN
    DIVIDE(
		__COUNT * __SUM_XY - __SUM_X * __SUM_Y * 1.,
		SQRT(
			(__COUNT * __SUM_X2 - __SUM_X ^ 2)
				* (__COUNT * __SUM_Y2 - __SUM_Y ^ 2)
		)
	)
The syntax does not have errors, but the column does not show any value or error.
If you have ideas how to solve this, please help me🙏
Thank you all in advance
Peru
Helpful resources

Microsoft Fabric Learn Together
Covering the world! 9:00-10:30 AM Sydney, 4:00-5:30 PM CET (Paris/Berlin), 7:00-8:30 PM Mexico City

Power BI Monthly Update - April 2024
Check out the April 2024 Power BI update to learn about new features.

| User | Count |
|---|---|
| 41 | |
| 21 | |
| 21 | |
| 14 | |
| 13 |
| User | Count |
|---|---|
| 43 | |
| 32 | |
| 30 | |
| 18 | |
| 18 |

