- Power BI forums
- Updates
- News & Announcements
- Get Help with Power BI
- Desktop
- Service
- Report Server
- Power Query
- Mobile Apps
- Developer
- DAX Commands and Tips
- Custom Visuals Development Discussion
- Health and Life Sciences
- Power BI Spanish forums
- Translated Spanish Desktop
- Power Platform Integration - Better Together!
- Power Platform Integrations (Read-only)
- Power Platform and Dynamics 365 Integrations (Read-only)
- Training and Consulting
- Instructor Led Training
- Dashboard in a Day for Women, by Women
- Galleries
- Community Connections & How-To Videos
- COVID-19 Data Stories Gallery
- Themes Gallery
- Data Stories Gallery
- R Script Showcase
- Webinars and Video Gallery
- Quick Measures Gallery
- 2021 MSBizAppsSummit Gallery
- 2020 MSBizAppsSummit Gallery
- 2019 MSBizAppsSummit Gallery
- Events
- Ideas
- Custom Visuals Ideas
- Issues
- Issues
- Events
- Upcoming Events
- Community Blog
- Power BI Community Blog
- Custom Visuals Community Blog
- Community Support
- Community Accounts & Registration
- Using the Community
- Community Feedback
Register now to learn Fabric in free live sessions led by the best Microsoft experts. From Apr 16 to May 9, in English and Spanish.
- Power BI forums
- Forums
- Get Help with Power BI
- DAX Commands and Tips
- Re: Compare only matching producs and calculate su...
- Subscribe to RSS Feed
- Mark Topic as New
- Mark Topic as Read
- Float this Topic for Current User
- Bookmark
- Subscribe
- Printer Friendly Page
- Mark as New
- Bookmark
- Subscribe
- Mute
- Subscribe to RSS Feed
- Permalink
- Report Inappropriate Content
Compare only matching producs and calculate subtotals/totals
HI PBI Community,
I have the following issue
I have the following raw data - every week I get new data from different websites (column Websites), with many different Brands (>100), different Segments (column Segment 2) and Products. I have prices and the volume is the same for every product, no matter which brand – e.g product 1 will have a volume of 47 948 for every brand etc.)
I need to weight the price with the volume and then compare each product with weighted price of my house brand. Basically compare how much cheaper or more expensive the other brands are compared to my products on product, segment 2 and brand level.
The problem is that for some products only one of the two compared brands has a price.
I tried to exclude the products without price with ISBLANK but it’s not working properly.
I found a way where I manually filter the table with “is not blank” but this trick doesn’t work on Totals and I can’t use it for line charts.
So how to compare only the product that have prices, so the subtotals and totals will be correct?
Here the screenshots for more details:
SUMX Price*Volume = sumx('Table','Table'[Price]*'Table'[Volume])
Sumx House Brand = CALCULATE([SUMX Price*Volume],'Table'[Brand]="House Brand")
Index = DIVIDE([SUMX Price*Volume],[Sumx House Brand])
Index if blank = if(ISBLANK([SUMX Price*Volume]),BLANK(), DIVIDE([SUMX Price*Volume],[Sumx House Brand]))
Thanks & BR
- Mark as New
- Bookmark
- Subscribe
- Mute
- Subscribe to RSS Feed
- Permalink
- Report Inappropriate Content
Hello,
here is the sample data - https://we.tl/t-hPwuemDKr8
The expected outcome is seen in the screenshots.
- Mark as New
- Bookmark
- Subscribe
- Mute
- Subscribe to RSS Feed
- Permalink
- Report Inappropriate Content
Thank you for providing the sample data. That helps a lot with proposing a potential solution.
Something like this?
- Mark as New
- Bookmark
- Subscribe
- Mute
- Subscribe to RSS Feed
- Permalink
- Report Inappropriate Content
Hi Ibendlin,
unfortunately, no 🙂
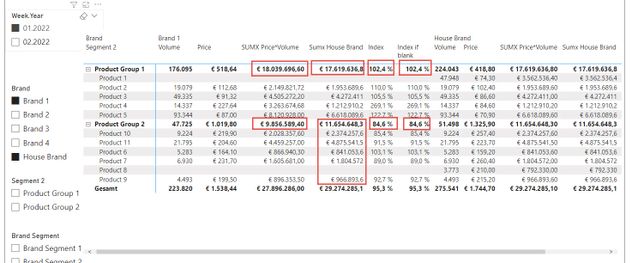
Here is again a screenshot with my expected outcome: I need a matrix, that compares all the brands with my house brand on product, product group and brand level - e.g how much cheaper or more expensive the other brands are. The problem is, that there are not always prices for all products - from the screenshot - in Week 02.2022 under product group 1 I have 5 products in total , but for Brand 1 I have prices only for Product 2,3,5 but my house brand has prices for all the 5 products. I need the measure the calculate only the index base on those 3 matching products, that the brands have in common during this week. My measure is
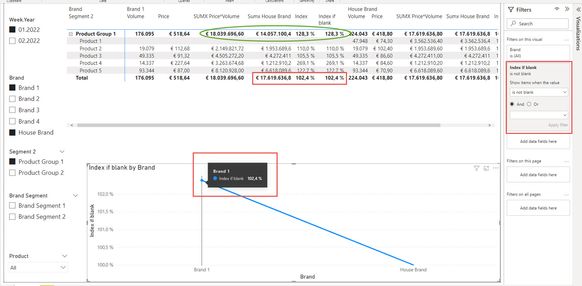
I also want the see the brand index in a line graph - I tried to add here again the manuall filter "[SUMX Price*Volume]" is not blank or "Index if blank" is not blank, but it seem that trick doesn`t work here - I still have the wrong brand indexes in the graph.
BR
- Mark as New
- Bookmark
- Subscribe
- Mute
- Subscribe to RSS Feed
- Permalink
- Report Inappropriate Content
Ich versteh's immer noch nicht. Was muss hier anders sein?
- Mark as New
- Bookmark
- Subscribe
- Mute
- Subscribe to RSS Feed
- Permalink
- Report Inappropriate Content
Hello Ibedlin
I buiolt the same report with data sample. But I do not succeed to have the %RT PV on sub toatals and total.
How do you manage to get it ,
Thanks
James
- Mark as New
- Bookmark
- Subscribe
- Mute
- Subscribe to RSS Feed
- Permalink
- Report Inappropriate Content
@Anonymous
It's a standard implicit measure format
- Mark as New
- Bookmark
- Subscribe
- Mute
- Subscribe to RSS Feed
- Permalink
- Report Inappropriate Content
Hi,
I'll continue in english, so the others will also understand 🙂
You are calculating % of every brand from column total, right?
I don't need this - I need to compare every brand to my house brand and get an index - e.g Brand 1/House Brand, Brand 2/ House Brand, etc. that's why I use these measures - Index if blank = if(ISBLANK([SUMX Price*Volume]),BLANK(), DIVIDE([SUMX Price*Volume],[Sumx House Brand])) and SUMX Price*Volume = sumx('Table','Table'[Price]*'Table'[Volume])
The problem is it doesn't ignore the empty values - as described above - in week 02.2022 for brand 1 I have Products 2,3,5 and I want the index measure to compare these 3 products with the same 3 products of my house brand. BUT since my house brand has all 5 products, the measure compare the sumx of the 3 product of brand 1 to the sumx of all 5 products of my house brand and this makes the index wrong.
here a more simplified example:
the numbers in red are wrong, because it's the total for all 5 product and I need the total from the 3 products, that both brands have.
and here how it shoud look like: you can clearly see the difference in the index.
- Mark as New
- Bookmark
- Subscribe
- Mute
- Subscribe to RSS Feed
- Permalink
- Report Inappropriate Content
"I want the index measure to compare these 3 products with the same 3 products of my house brand."
You are going deep (very deep) into the "black cat in a dark room" territory. You are trying to measure things that are not there. That always requires disconnected tables with crossjoins - in your case between Brand, Segment 2, and Product. It also means you have to completely redo your visual. It can be done, but has a high effort.
- Mark as New
- Bookmark
- Subscribe
- Mute
- Subscribe to RSS Feed
- Permalink
- Report Inappropriate Content
Hi,
the things I'm trying to measure are most definetely there, and it's basically a "standart" business world problem, I think you didn't quite understood the problem and what I wanted to calculate. Neverthelles, I found a solution, and as a though, it was pretty simple to implement.
Thanks for the help.
- Mark as New
- Bookmark
- Subscribe
- Mute
- Subscribe to RSS Feed
- Permalink
- Report Inappropriate Content
Please provide sanitized sample data that fully covers your issue. If you paste the data into a table in your post or use one of the file services it will be easier to assist you. Avoid posting screenshots of your source data if possible.
Please show the expected outcome based on the sample data you provided. Screenshots of the expected outcome are ok.
https://community.powerbi.com/t5/Desktop/How-to-Get-Your-Question-Answered-Quickly/m-p/1447523
Helpful resources

Microsoft Fabric Learn Together
Covering the world! 9:00-10:30 AM Sydney, 4:00-5:30 PM CET (Paris/Berlin), 7:00-8:30 PM Mexico City

Power BI Monthly Update - April 2024
Check out the April 2024 Power BI update to learn about new features.

| User | Count |
|---|---|
| 43 | |
| 21 | |
| 20 | |
| 15 | |
| 13 |
| User | Count |
|---|---|
| 45 | |
| 41 | |
| 39 | |
| 19 | |
| 19 |


