- Power BI forums
- Updates
- News & Announcements
- Get Help with Power BI
- Desktop
- Service
- Report Server
- Power Query
- Mobile Apps
- Developer
- DAX Commands and Tips
- Custom Visuals Development Discussion
- Health and Life Sciences
- Power BI Spanish forums
- Translated Spanish Desktop
- Power Platform Integration - Better Together!
- Power Platform Integrations (Read-only)
- Power Platform and Dynamics 365 Integrations (Read-only)
- Training and Consulting
- Instructor Led Training
- Dashboard in a Day for Women, by Women
- Galleries
- Community Connections & How-To Videos
- COVID-19 Data Stories Gallery
- Themes Gallery
- Data Stories Gallery
- R Script Showcase
- Webinars and Video Gallery
- Quick Measures Gallery
- 2021 MSBizAppsSummit Gallery
- 2020 MSBizAppsSummit Gallery
- 2019 MSBizAppsSummit Gallery
- Events
- Ideas
- Custom Visuals Ideas
- Issues
- Issues
- Events
- Upcoming Events
- Community Blog
- Power BI Community Blog
- Custom Visuals Community Blog
- Community Support
- Community Accounts & Registration
- Using the Community
- Community Feedback
Register now to learn Fabric in free live sessions led by the best Microsoft experts. From Apr 16 to May 9, in English and Spanish.
- Power BI forums
- Forums
- Get Help with Power BI
- DAX Commands and Tips
- Re: Calculating Monthly Difference and Formatting ...
- Subscribe to RSS Feed
- Mark Topic as New
- Mark Topic as Read
- Float this Topic for Current User
- Bookmark
- Subscribe
- Printer Friendly Page
- Mark as New
- Bookmark
- Subscribe
- Mute
- Subscribe to RSS Feed
- Permalink
- Report Inappropriate Content
Calculating Monthly Difference and Formatting Accordingly
@lbendlin I deleted the post you commented on and re-wrote it here as it would seem that this is a way to reference a previous column via a measure (might be mis-stating that, but conceptually - that's what's going on). I just don't understand what @tom480 did as, which I explain below, he references his own made up data and I don't quite understand the formula's he's posting (I'm quite new, sorry). Also, and again, please forgive my ignorance, I don't know how to link a PBI report into this thread and would need to know how to remove the SQL connection that is used to produce my Invoice table below as it has containes the connection details to my work's database. Praying you, or someone, can just help in fixing Tom's measure's below using the real tables I've pasted with just a brief description of the DAX please.
Good day! I started this conversation in this thread but it became extremely convoluted with different topics as the solution required use of creating a date table (which I have since been able to successfully resolve) however the other part of the conversation (which directly impacts the original quesiton) was lost in the mix and I was having difficulty understanding parts of it so thought I'd be open to either other suggestions or beg help in understanding what one of the authors, @tom480 had suggested.
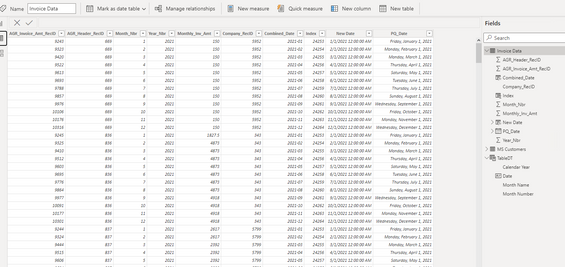
The Challenge: I have a table created that pulls in invoices from various customers (Screen Shot 2). I have a date table that I had help in building (Screen Shot 3). It is displayed in a matrix nicely (Screen Shot 1). What I am trying to do is highlight the "next" month if it there is greater than a 5% change from their previous month's invoice (either up or down) so that a sales person can figure out why. In the proposed solution, it was suggested the following:
The first measure (that you already have) is in my case this one:
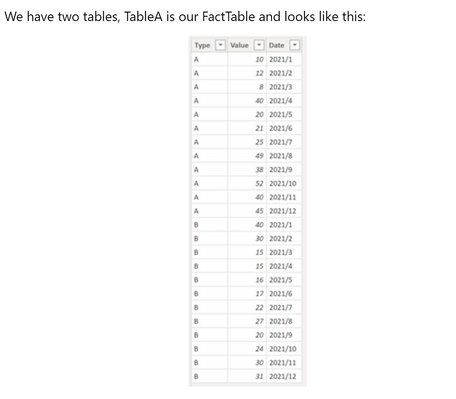
(My note: I assumed this measure to be SUM ( 'Invoice Data'[Montly_Inv_Amt]) but, I am having difficulty understanding his logic His two tables used as an example are below (Screen Shots 4 & 5)
ValueMeasure = SUM ( TableA[Value] )Second, we need another measure that calculates the difference (%) between each month. I just created this one quickly, but pressumably you need to calculate it differently. The point of my reply is not showing how to calculate such a differences but more how you can use such a measure for color coding:
(My note: IThis is where I get really confused.
- His TableB, which I assume is meant to be the date table (TableDT) as a "DateIndex" field. The DateTable doesn't and I'm not sure what to reference.
- This is completely my ignorance, but I am NOT savvy with DAX and not understanding what the CALCULATE functions are doing here, nor how to relate them to my 'actual' tables. (I feel horrible, but understanding what these functions are doing and re-writing them as they relate to my two tables (Screen shots 2 & 3) would be VERY helpful/appreciated.
- I somewhat understand what he's doing in DIVIDE (subtracting the difference and dividing that by the amount of previous month to get a percentage, but the "+0" confused me.
ValuesMeasureDiff% =
VAR _valueCurrentMonth = CALCULATE ( [ValueMeasure], TableB[DateIndex] = MAX ( TableB[DateIndex] ) )
VAR _valuePreviousMonth = CALCULATE ( [ValueMeasure], ALLEXCEPT(TableA, TableA[Type] ), TableB[DateIndex] = MAX ( TableB[DateIndex] ) - 1 )
RETURN
DIVIDE (_valueCurrentMonth - _valuePreviousMonth, _valuePreviousMonth ) + 0
Where to put the measures then, within the matrix visualization, (in other words, where to go from there) is also confusing.
If there is a better/different way of doing this, I'm open...but, and it pains me deeply to say this, I'm new to PowerBI so explaining (high level) what a function is doing (more so that just inserting it there) or, at least, helping me by using real values from the tables I pasted below would be VERY helpful. I am NOT trying to make light of Tom's assistance, he truly went above and beyond. But I'm simply having difficult understanding his measures - especially when it's not using columns from my tables.
Screen Shot 1 - Where I'm at now
Screen Shot 2 - The Invoice Data table
Screen Shot 3 - The TableDT table
Screen Shot 4 - His "TableA" used in his example
Screen Shot 5 - His "TableB" used in his example
- Mark as New
- Bookmark
- Subscribe
- Mute
- Subscribe to RSS Feed
- Permalink
- Report Inappropriate Content
Hi @Anonymous,
Any update for these? Did the above suggestion help with your scenario? if that is the case, you can consider Kudo or accept the helpful suggestions to help others who faced similar requirements.
If these also don't help, please share more detailed information to help us clarify your scenario to test.
How to Get Your Question Answered Quickly
Regards,
Xiaoxin Sheng
If this post helps, please consider accept as solution to help other members find it more quickly.
- Mark as New
- Bookmark
- Subscribe
- Mute
- Subscribe to RSS Feed
- Permalink
- Report Inappropriate Content
Hi @Anonymous
I sent you eamil. Please check
Helpful resources

Microsoft Fabric Learn Together
Covering the world! 9:00-10:30 AM Sydney, 4:00-5:30 PM CET (Paris/Berlin), 7:00-8:30 PM Mexico City

Power BI Monthly Update - April 2024
Check out the April 2024 Power BI update to learn about new features.

| User | Count |
|---|---|
| 40 | |
| 20 | |
| 19 | |
| 15 | |
| 15 |
| User | Count |
|---|---|
| 47 | |
| 28 | |
| 25 | |
| 17 | |
| 17 |


