- Power BI forums
- Updates
- News & Announcements
- Get Help with Power BI
- Desktop
- Service
- Report Server
- Power Query
- Mobile Apps
- Developer
- DAX Commands and Tips
- Custom Visuals Development Discussion
- Health and Life Sciences
- Power BI Spanish forums
- Translated Spanish Desktop
- Power Platform Integration - Better Together!
- Power Platform Integrations (Read-only)
- Power Platform and Dynamics 365 Integrations (Read-only)
- Training and Consulting
- Instructor Led Training
- Dashboard in a Day for Women, by Women
- Galleries
- Community Connections & How-To Videos
- COVID-19 Data Stories Gallery
- Themes Gallery
- Data Stories Gallery
- R Script Showcase
- Webinars and Video Gallery
- Quick Measures Gallery
- 2021 MSBizAppsSummit Gallery
- 2020 MSBizAppsSummit Gallery
- 2019 MSBizAppsSummit Gallery
- Events
- Ideas
- Custom Visuals Ideas
- Issues
- Issues
- Events
- Upcoming Events
- Community Blog
- Power BI Community Blog
- Custom Visuals Community Blog
- Community Support
- Community Accounts & Registration
- Using the Community
- Community Feedback
Register now to learn Fabric in free live sessions led by the best Microsoft experts. From Apr 16 to May 9, in English and Spanish.
- Power BI forums
- Community Blog
- Power BI Community Blog
- Industrial historian data retrieval using Power BI
- Subscribe to RSS Feed
- Mark as New
- Mark as Read
- Bookmark
- Subscribe
- Printer Friendly Page
- Report Inappropriate Content
- Subscribe to RSS Feed
- Mark as New
- Mark as Read
- Bookmark
- Subscribe
- Printer Friendly Page
- Report Inappropriate Content
Introduction
Recently, Intelligent Plant helped facilitate the OGTC Codeless Hackathon event. That’s the Oil & Gas Technology Centre – who’s mission statement is to unlock the full potential of the UK North Sea through innovation and transformation. It was really something else. Over a hundred people from all over the world signed up for a four-day “hackathon challenge”.
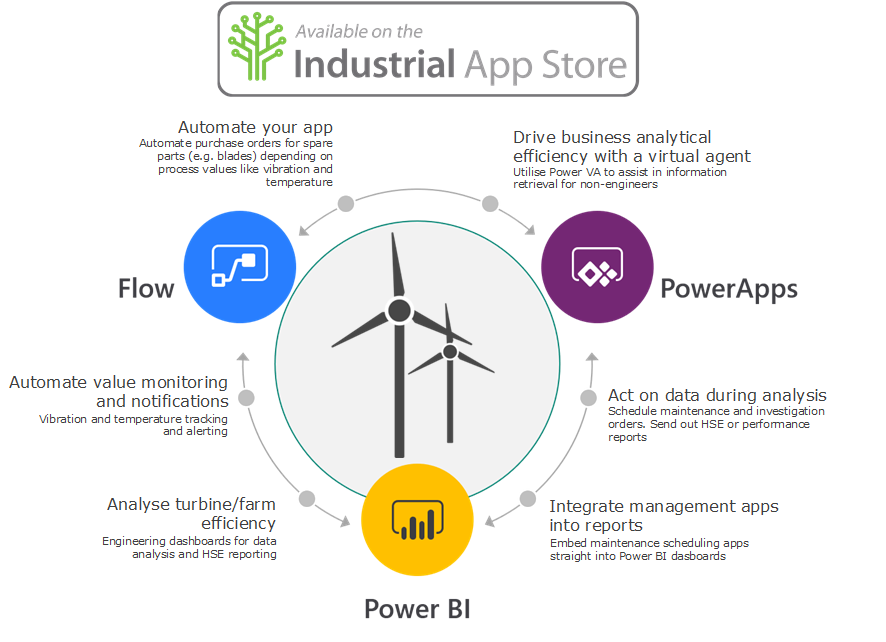
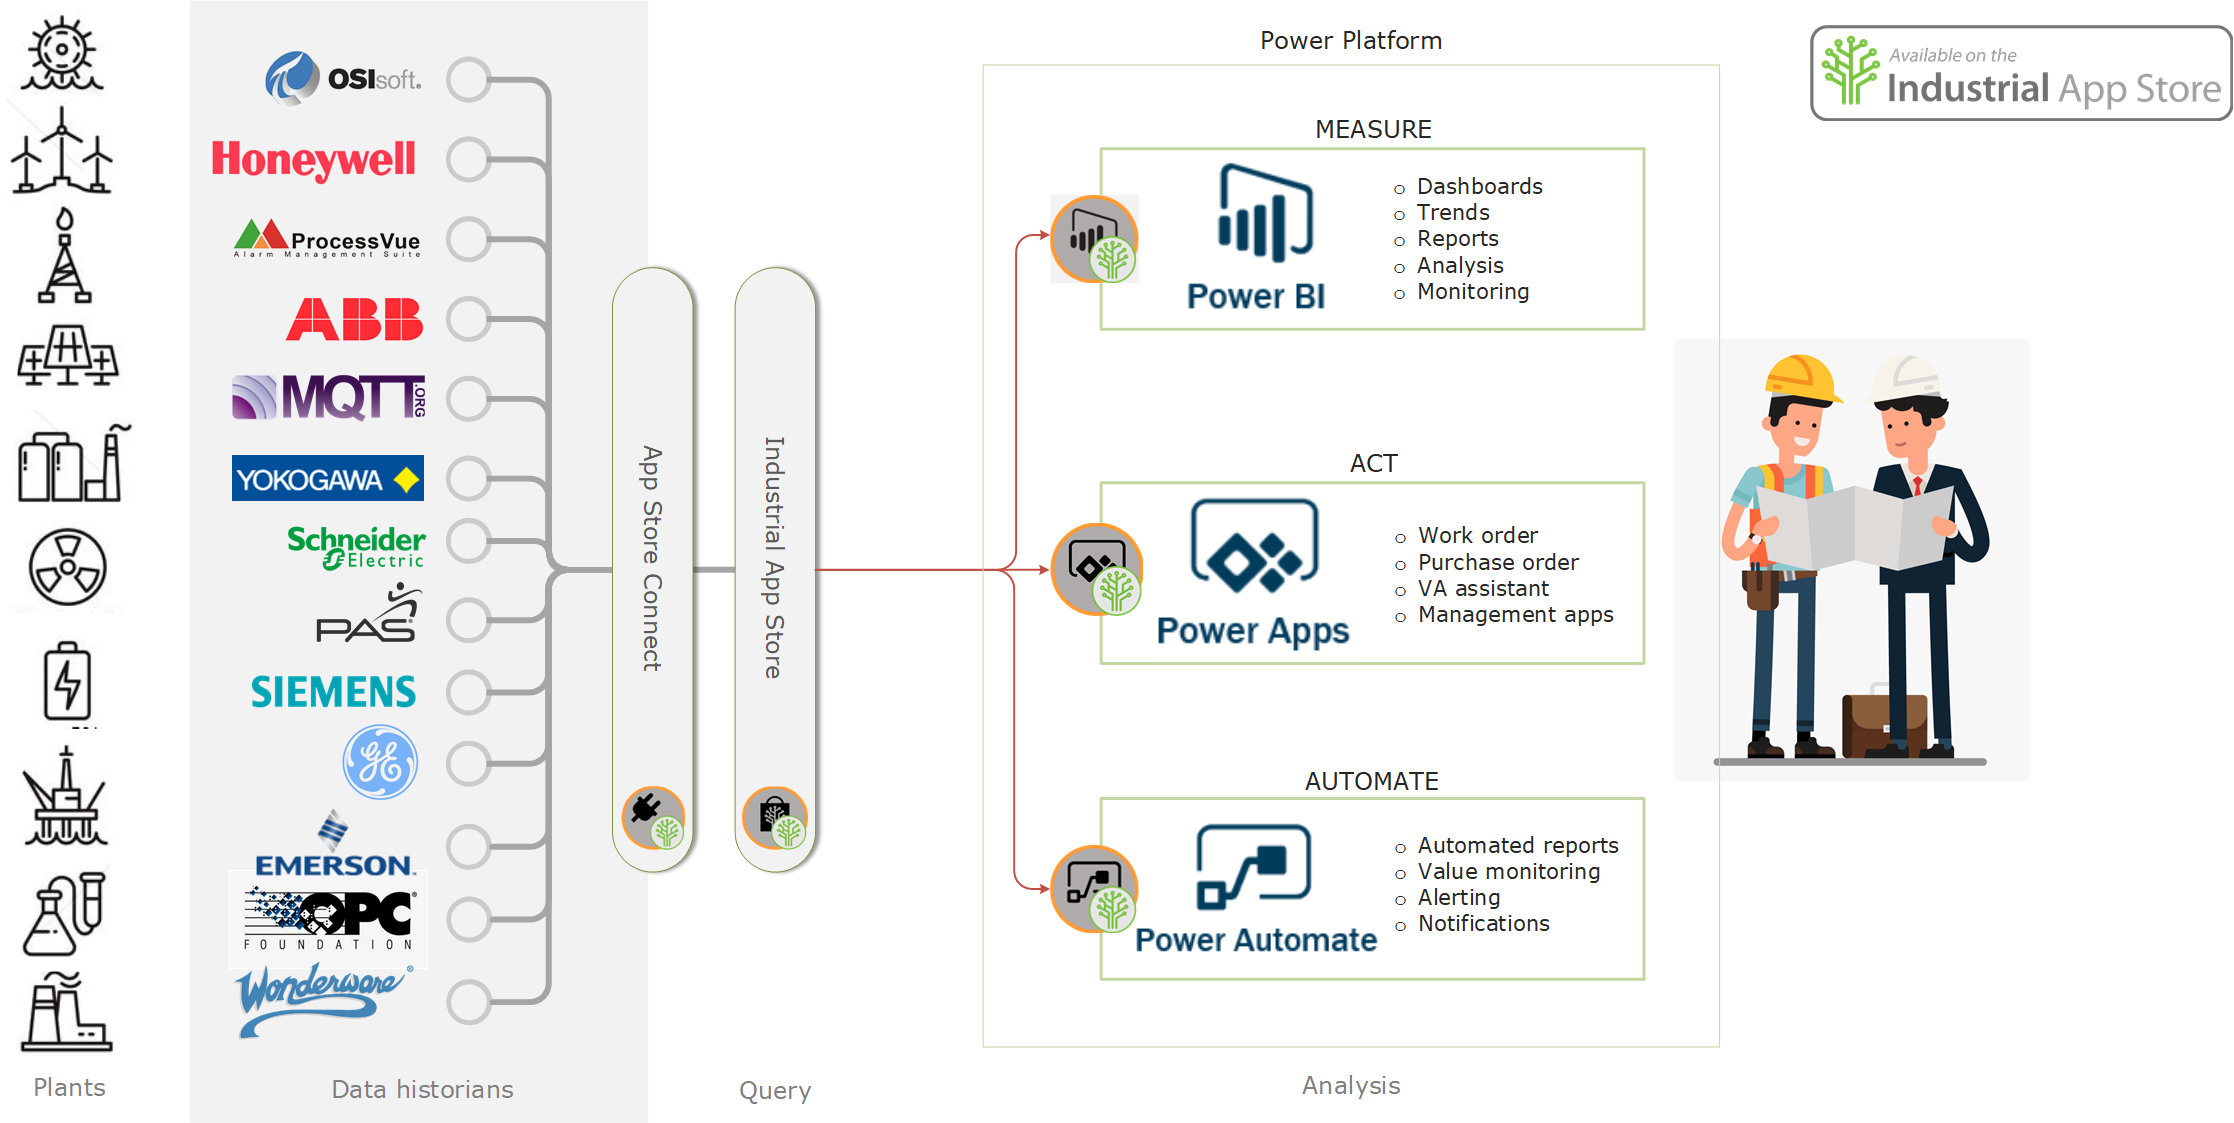
The objective was to demonstrate how anyone can become an Industrial Data Scientist if given the right tools. Microsoft provided tutorials and mentoring for their Power Platform. Organizations such as Ithaca Energy and ORE Catapult set challenges that were based on genuine issues they face in their industrial processes, and Intelligent Plant provided the connectivity that allowed participants to directly connect Power Platform tools to Industrial Data Stores such as OSIsoft PI Historian.
Problem
(You can find the event outline here)
We encountered that many energy industry data scientists think they need to get all available raw data to solve a problem or to investigate an issue. When interfacing industrial historians this can be an issue because the total amount of data can reach up a 10+ GB depending on time range and resolution requested. At that point, you have to go down the route of importing data into a different store and write custom queries to attempt to retrieve it just to find out that half the data is missing because you didn't handle some special case when a value flashes up as NULL or has bad bits recorded.
Solution
(You can find the dashboard described below here: Industrial Historian data retrieval using Power BI)
Using Industrial App Store (IAS) Power BI connector we can create a sample dashboard where we don't need have all the raw data handy because we can dynamically re-query for specific time periods that we are interested in and update the dashboard.
To start with the trend is displaying the last 300 days. IAS allows us to specify time constraints using relative time periods which I'm utilising here. The main advantage of this is so when I publish this dashboard onto Power BI service and set up a background refresh it will always be up to date.
To accurately visualise the trend we only require 2000 points. Because my dashboard is less than 2000 pixels wide and I can't show any more resolution anyway (i.e. if I request 5k points there just isn't enough real estate to display that and at least 3k points will be discarded). When I want to zoom in and examine an area of interest I can simply edit the parameters and set the time span I'm interested in.
The number of points is still 2000 but I'm seeing much more detail because my timespan is much shorter. I'm using the PLOT aggregation which is specifically designed to show the best shape of the trend by representing all the peaks and throughs.
Utilising the parameters in power BI I transfer only the data that I'm interested in thus reducing bandwidth, load on the source system as well as my own computer. I don't need to extract 10 years worth of raw data, which will take a long time even if industrials historians support that e.g. CSV file for 1 month with 575 Tags at 1s resolution is a 9GB file and if you want 10 years of data, well you can do the math...
Furthermore, we can utilise the above parameters with Alarm and Event (A&E) data to further investigate issues.
A good place to start is to look at the sequence of events report (SoE). To browse SoE data, which can be millions of rows/events I can further parameterise the query by adding page number and page size properties to my report. The report is still filtered by the dates but having paging parameters allows us to drill down to a specific event e.g. shutdown.
Again we are not downloading 10 years worth of events because some systems might contain a lot of noise that contribute to the overall size. For example, some assets might record a million events for 5 hours during a significant event (e.g. shutdown) so you can only imagine what 10 years would look like...
Conclusion
Industrial App Store enables Power Platform data retrieval that can show a great level of detail for data scientists to come up with a machine learning algorithms without having tons of raw data downloaded or a brief summary overview that engineers can use to spot an issue.

Related content
Connecting industrial historians to Microsoft Power BI. One connector to get them all…
Industrial Historian data retrieval using Power BI
Alarm Analysis Dashboard design insights
Power BI and Alarm & Event Bad Actors
Useful links
You must be a registered user to add a comment. If you've already registered, sign in. Otherwise, register and sign in.
- Dynamic rollback of the previous N weeks of data
- Supercharge Your Visuals: Easy Conditional Formatt...
- The using of Cartesian products in many-to-many re...
- How to Filter similar Columns Based on Specific Co...
- Power BI Dynamic Date Filters: Automatically Updat...
- Enhanced Data Profiling in Power Query: GUI and Ta...
- How to use Tooltip to display breakdown data for a...
- Unveiling the Power of Lakehouse's SQL Analytics E...
- [DAX] Time Intelligence vs WINDOW vs OFFSET
- Display data in a fixed order and show data for th...
- joseftantawi on: How to customize open-sourced custom visual.
- kalpeshdangar on: Creating Custom Calendars for Accurate Working Day...
- gwayne on: Embracing TMDL Functionalities in Power BI and Pre...
- jian123 on: Sharing Power Query tables
-
 Martin_D
on:
From the Desk of An Experienced Power BI Analyst
Martin_D
on:
From the Desk of An Experienced Power BI Analyst
-
ibarrau
on:
[PowerQuery] Catch errors in a request http
- Aditya07 on: How to import customised themes in Power BI - usin...
-
Martin_D
on:
Currency Conversion in Power BI: Enabling Seamless...
-
technolog
on:
Unveiling Top Products with categories: A Guide to...
-
Ritaf1983
on:
When Big Numbers Become Big Problems
-
How To
573 -
Tips & Tricks
526 -
Support insights
121 -
Events
107 -
DAX
66 -
Power BI
65 -
Opinion
64 -
Power Query
62 -
Power BI Desktop
40 -
Power BI Dev Camp
36 -
Roundup
31 -
Power BI Embedded
20 -
Time Intelligence
19 -
Tips&Tricks
18 -
PowerBI REST API
12 -
Power Query Tips & Tricks
8 -
finance
8 -
Power BI Service
8 -
Direct Query
7 -
Power BI REST API
6 -
Auto ML
6 -
financial reporting
6 -
Data Analysis
6 -
Power Automate
6 -
Data Visualization
6 -
Python
6 -
Dax studio
5 -
Income Statement
5 -
powerbi
5 -
service
5 -
Power BI PowerShell
5 -
Machine Learning
5 -
Featured User Group Leader
5 -
External tool
4 -
Paginated Reports
4 -
Power BI Goals
4 -
PowerShell
4 -
Desktop
4 -
Bookmarks
4 -
Group By
4 -
Line chart
4 -
community
4 -
RLS
4 -
M language
4 -
Visualisation
3 -
Administration
3 -
M code
3 -
SQL Server 2017 Express Edition
3 -
Visuals
3 -
R script
3 -
Aggregation
3 -
Dataflow
3 -
calendar
3 -
Gateways
3 -
R
3 -
M Query
3 -
R visual
3 -
Webinar
3 -
CALCULATE
3 -
Reports
3 -
PowerApps
3 -
Data Science
3 -
Azure
3 -
Data model
3 -
Conditional Formatting
3 -
Forecasting
2 -
REST API
2 -
Editor
2 -
Working with Non Standatd Periods
2 -
powerbi.tips
2 -
Custom function
2 -
Reverse
2 -
measure
2 -
Microsoft-flow
2 -
Paginated Report Builder
2 -
PUG
2 -
Custom Measures
2 -
Filtering
2 -
Row and column conversion
2 -
Python script
2 -
Nulls
2 -
DVW Analytics
2 -
Industrial App Store
2 -
Week
2 -
Date duration
2 -
parameter
2 -
Weekday Calendar
2 -
Support insights.
2 -
construct list
2 -
Formatting
2 -
Power Platform
2 -
Workday
2 -
external tools
2 -
slicers
2 -
SAP
2 -
index
2 -
RANKX
2 -
Integer
2 -
PBI Desktop
2 -
Date Dimension
2 -
Power BI Challenge
2 -
Query Parameter
2 -
Visualization
2 -
Tabular Editor
2 -
Date
2 -
SharePoint
2 -
Power BI Installation and Updates
2 -
How Things Work
2 -
troubleshooting
2 -
Date DIFF
2 -
Transform data
2 -
rank
2 -
ladataweb
2 -
Tips and Tricks
2 -
Incremental Refresh
2 -
Query Plans
2 -
Power BI & Power Apps
2 -
Random numbers
2 -
Day of the Week
2 -
Number Ranges
2 -
M
2 -
hierarchies
2 -
Power BI Anniversary
2 -
Language M
2 -
Custom Visual
2 -
VLOOKUP
2 -
pivot
2 -
calculated column
2 -
Power BI Premium Per user
2 -
inexact
2 -
Date Comparison
2 -
Split
2 -
API
1 -
Kingsley
1 -
Merge
1 -
variable
1 -
financial reporting hierarchies RLS
1 -
Featured Data Stories
1 -
MQTT
1 -
Custom Periods
1 -
Partial group
1 -
Reduce Size
1 -
FBL3N
1 -
Wednesday
1 -
help
1 -
group
1 -
Scorecard
1 -
Json
1 -
Tops
1 -
Multivalued column
1 -
pipeline
1 -
Path
1 -
Yokogawa
1 -
Dynamic calculation
1 -
Data Wrangling
1 -
native folded query
1 -
transform table
1 -
UX
1 -
Cell content
1 -
General Ledger
1 -
Thursday
1 -
Power Pivot
1 -
Quick Tips
1 -
data
1 -
PBIRS
1 -
Usage Metrics in Power BI
1 -
HR Analytics
1 -
keepfilters
1 -
Connect Data
1 -
Financial Year
1 -
Schneider
1 -
dynamically delete records
1 -
Copy Measures
1 -
Friday
1 -
Table
1 -
Natural Query Language
1 -
Infographic
1 -
automation
1 -
Prediction
1 -
newworkspacepowerbi
1 -
Performance KPIs
1 -
Active Employee
1 -
Custom Date Range on Date Slicer
1 -
refresh error
1 -
PAS
1 -
certain duration
1 -
DA-100
1 -
bulk renaming of columns
1 -
Single Date Picker
1 -
Monday
1 -
PCS
1 -
Saturday
1 -
Q&A
1 -
Event
1 -
Custom Visuals
1 -
Free vs Pro
1 -
Format
1 -
Current Employees
1 -
date hierarchy
1 -
relationship
1 -
SIEMENS
1 -
Multiple Currency
1 -
Power BI Premium
1 -
On-premises data gateway
1 -
Binary
1 -
Power BI Connector for SAP
1 -
Sunday
1 -
update
1 -
Slicer
1 -
Visual
1 -
forecast
1 -
Regression
1 -
CICD
1 -
sport statistics
1 -
Intelligent Plant
1 -
Circular dependency
1 -
GE
1 -
Exchange rate
1 -
Dendrogram
1 -
range of values
1 -
activity log
1 -
Decimal
1 -
Charticulator Challenge
1 -
Field parameters
1 -
Training
1 -
Announcement
1 -
Features
1 -
domain
1 -
pbiviz
1 -
Color Map
1 -
Industrial
1 -
Weekday
1 -
Working Date
1 -
Space Issue
1 -
Emerson
1 -
Date Table
1 -
Cluster Analysis
1 -
Stacked Area Chart
1 -
union tables
1 -
Number
1 -
Start of Week
1 -
Tips& Tricks
1 -
deployment
1 -
ssrs traffic light indicators
1 -
SQL
1 -
trick
1 -
Scripts
1 -
Extract
1 -
Topper Color On Map
1 -
Historians
1 -
context transition
1 -
Custom textbox
1 -
OPC
1 -
Zabbix
1 -
Label: DAX
1 -
Business Analysis
1 -
Supporting Insight
1 -
rank value
1 -
Synapse
1 -
End of Week
1 -
Tips&Trick
1 -
Workspace
1 -
Theme Colours
1 -
Text
1 -
Flow
1 -
Publish to Web
1 -
patch
1 -
Top Category Color
1 -
A&E data
1 -
Previous Order
1 -
Substring
1 -
Wonderware
1 -
Power M
1 -
Format DAX
1 -
Custom functions
1 -
accumulative
1 -
DAX&Power Query
1 -
Premium Per User
1 -
GENERATESERIES
1 -
Showcase
1 -
custom connector
1 -
Waterfall Chart
1 -
Power BI On-Premise Data Gateway
1 -
step by step
1 -
Top Brand Color on Map
1 -
Tutorial
1 -
Previous Date
1 -
XMLA End point
1 -
color reference
1 -
Date Time
1 -
Marker
1 -
Lineage
1 -
CSV file
1 -
conditional accumulative
1 -
Matrix Subtotal
1 -
Check
1 -
null value
1 -
Report Server
1 -
Audit Logs
1 -
analytics pane
1 -
mahak
1 -
pandas
1 -
Networkdays
1 -
Button
1 -
Dataset list
1 -
Keyboard Shortcuts
1 -
Fill Function
1 -
LOOKUPVALUE()
1 -
Tips &Tricks
1 -
Plotly package
1 -
refresh M language Python script Support Insights
1 -
Excel
1 -
Cumulative Totals
1 -
Report Theme
1 -
Bookmarking
1 -
oracle
1 -
Canvas Apps
1 -
total
1 -
Filter context
1 -
Difference between two dates
1 -
get data
1 -
OSI
1 -
Query format convert
1 -
ETL
1 -
Json files
1 -
Merge Rows
1 -
CONCATENATEX()
1 -
take over Datasets;
1 -
Networkdays.Intl
1 -
Get row and column totals
1 -
Sameperiodlastyear
1 -
Office Theme
1 -
matrix
1 -
bar chart
1 -
Measures
1 -
powerbi argentina
1 -
Model Driven Apps
1 -
REMOVEFILTERS
1 -
XMLA endpoint
1 -
translations
1 -
OSI pi
1 -
Parquet
1 -
Change rows to columns
1 -
remove spaces
1 -
Azure AAD
1 -
Governance
1 -
Fun
1 -
Power BI gateway
1 -
gateway
1 -
Elementary
1 -
Custom filters
1 -
Vertipaq Analyzer
1 -
powerbi cordoba
1 -
DIisconnected Tables
1 -
Sandbox
1 -
Honeywell
1 -
Combine queries
1 -
X axis at different granularity
1 -
ADLS
1 -
Primary Key
1 -
Microsoft 365 usage analytics data
1 -
Randomly filter
1 -
Week of the Day
1 -
Get latest sign-in data for each user
1 -
Retail
1 -
Power BI Report Server
1 -
School
1 -
Cost-Benefit Analysis
1 -
ISV
1 -
Ties
1 -
unpivot
1 -
Practice Model
1 -
Continuous streak
1 -
ProcessVue
1 -
Create function
1 -
Table.Schema
1 -
Acknowledging
1 -
Postman
1 -
Text.ContainsAny
1 -
Power BI Show
1 -
query
1 -
Dynamic Visuals
1 -
KPI
1 -
Intro
1 -
Icons
1 -
Issues
1 -
function
1 -
stacked column chart
1 -
ho
1 -
ABB
1 -
KNN algorithm
1 -
List.Zip
1 -
optimization
1 -
Artificial Intelligence
1 -
Map Visual
1 -
Text.ContainsAll
1 -
Tuesday
1