- Power BI forums
- Updates
- News & Announcements
- Get Help with Power BI
- Desktop
- Service
- Report Server
- Power Query
- Mobile Apps
- Developer
- DAX Commands and Tips
- Custom Visuals Development Discussion
- Health and Life Sciences
- Power BI Spanish forums
- Translated Spanish Desktop
- Power Platform Integration - Better Together!
- Power Platform Integrations (Read-only)
- Power Platform and Dynamics 365 Integrations (Read-only)
- Training and Consulting
- Instructor Led Training
- Dashboard in a Day for Women, by Women
- Galleries
- Community Connections & How-To Videos
- COVID-19 Data Stories Gallery
- Themes Gallery
- Data Stories Gallery
- R Script Showcase
- Webinars and Video Gallery
- Quick Measures Gallery
- 2021 MSBizAppsSummit Gallery
- 2020 MSBizAppsSummit Gallery
- 2019 MSBizAppsSummit Gallery
- Events
- Ideas
- Custom Visuals Ideas
- Issues
- Issues
- Events
- Upcoming Events
- Community Blog
- Power BI Community Blog
- Custom Visuals Community Blog
- Community Support
- Community Accounts & Registration
- Using the Community
- Community Feedback
Register now to learn Fabric in free live sessions led by the best Microsoft experts. From Apr 16 to May 9, in English and Spanish.
- Power BI forums
- Galleries
- COVID-19 Data Stories Gallery
- COVID-19 Coronavirus dashboard - Global pandemic
COVID-19 Coronavirus dashboard - Global pandemic
03-17-2020 06:22 AM - last edited 03-30-2020 17:24 PM


- Mark as New
- Bookmark
- Subscribe
- Mute
- Subscribe to RSS Feed
- Permalink
- Report Inappropriate Content
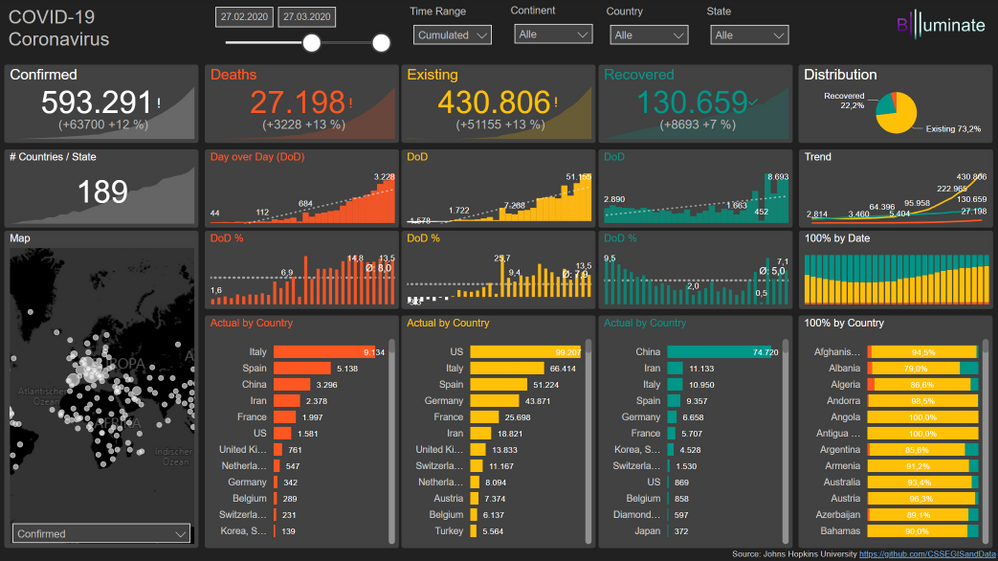
COVID-19 Coronavirus dashboard - Global pandemic
This Coronavirus dashboard has new insights & user interactions.
- New measure "Exsiting" = Confirmed - Deaths - Recovered
- Cumulated & daily view
- Percentage of deaths / exisiting / recovered
- Deviation absolute / percent to previous day
- Select date, continent, country & state
- 2 Views: By KPI tiles & country hierarchy with heatmap
My progress is on YouTube, where you can follow or redo the development steps. (language: German *Sorry*)
The source is based on the Johns Hopkins Univesity dashboard and dataset on github.
Have fun with my dashboard. I look forward to your feedback.
Best regards
Nico
eyJrIjoiYjdkZGFjMGEtOGMzZC00ZjAxLTg3ZGItOTVhMzc5NTVmMGQ2IiwidCI6IjdkYzExMmRlLTZhNTItNDA2OS1hN2Q1LWRjNzYzODMzNGMxYyIsImMiOjl9
- Mark as New
- Bookmark
- Subscribe
- Mute
- Subscribe to RSS Feed
- Permalink
- Report Inappropriate Content
Great Work!
I was just wondering how were you handling the scheduled refresh? I've noticed that your data only goes up until a few days before the current date.
Thanks!
- Mark as New
- Bookmark
- Subscribe
- Mute
- Subscribe to RSS Feed
- Permalink
- Report Inappropriate Content
Hi czaldumbide,
Thanks!
Short answer: I have to transform the data model each day manually.
Long:
The source is a Web URL API and should refresh automatically. But the datasets are not perfect. I have 2 options.
- Daily .csv-> new table each day
- Full time series .csv -> new column each day
I used the full time series because of less tables and joins. For a suitable data model I transformed each table (Confirmed, Deaths, Recovered). With a new columen every day I have to change the transformation steps daily (see attachments).
- Increase the number of columns
- Chance the data type to Int64
Maybe I overlook a better solution. Do you have an idea?
Best regards
Nico
*Update 18.04.2020*
Hint from user africat: Remove parameter "Columen=xx" in Data Transformation > Table > Source
- Mark as New
- Bookmark
- Subscribe
- Mute
- Subscribe to RSS Feed
- Permalink
- Report Inappropriate Content
Hey mate, great work on building this dashboard. I think the colors are suited for the current situation of confirmed case, recovered and very sadly the deaths...
I have a quick question: is the "Drilldown player" a custom visual built from your self?
Again. I liked the distribution and alignment of the visual. Congrats!
- Mark as New
- Bookmark
- Subscribe
- Mute
- Subscribe to RSS Feed
- Permalink
- Report Inappropriate Content
Hi cabc_xlorla,
the "Drilldown Player" is custom visual from
https://blog.pragmaticworks.com/power-bi-custom-visuals-drilldown-player
Great for the outbreak simulation. But I want dashboard without any third party components (only standard). Maybe I will remove it.
Thanks for your Feedback. I will improve the dashboard in the near future.
Nico