- Power BI forums
- Updates
- News & Announcements
- Get Help with Power BI
- Desktop
- Service
- Report Server
- Power Query
- Mobile Apps
- Developer
- DAX Commands and Tips
- Custom Visuals Development Discussion
- Health and Life Sciences
- Power BI Spanish forums
- Translated Spanish Desktop
- Power Platform Integration - Better Together!
- Power Platform Integrations (Read-only)
- Power Platform and Dynamics 365 Integrations (Read-only)
- Training and Consulting
- Instructor Led Training
- Dashboard in a Day for Women, by Women
- Galleries
- Community Connections & How-To Videos
- COVID-19 Data Stories Gallery
- Themes Gallery
- Data Stories Gallery
- R Script Showcase
- Webinars and Video Gallery
- Quick Measures Gallery
- 2021 MSBizAppsSummit Gallery
- 2020 MSBizAppsSummit Gallery
- 2019 MSBizAppsSummit Gallery
- Events
- Ideas
- Custom Visuals Ideas
- Issues
- Issues
- Events
- Upcoming Events
- Community Blog
- Power BI Community Blog
- Custom Visuals Community Blog
- Community Support
- Community Accounts & Registration
- Using the Community
- Community Feedback
Earn a 50% discount on the DP-600 certification exam by completing the Fabric 30 Days to Learn It challenge.
- Power BI forums
- Forums
- Get Help with Power BI
- Service
- Re: Can active Filter info be embedded in a visual...
- Subscribe to RSS Feed
- Mark Topic as New
- Mark Topic as Read
- Float this Topic for Current User
- Bookmark
- Subscribe
- Printer Friendly Page
- Mark as New
- Bookmark
- Subscribe
- Mute
- Subscribe to RSS Feed
- Permalink
- Report Inappropriate Content
Can active Filter info be embedded in a visual?
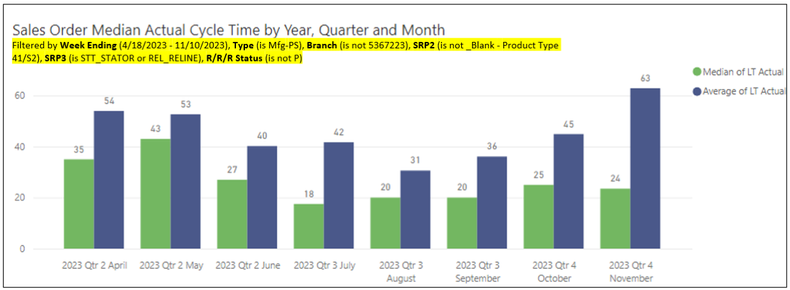
Is it possible to embed the active filter info into a visual (as in the highlight in the capture)? This would help with dashboard creation and use, especially if the same visual is put into a dashboard multiple times with different filter criteria applied to each. I know this can be done when copying and pasting a visual out of the service, but I want to have the same info visible within a visual that is in a dashboard.
Solved! Go to Solution.
- Mark as New
- Bookmark
- Subscribe
- Mute
- Subscribe to RSS Feed
- Permalink
- Report Inappropriate Content
And the other problem is that you have to specify every filter individually, which can be a real problem if there are dozens of filters. This solves that problem using DAX Studio. Take the results they put into a tooltip, and instead put that measure into the subtitle. Voila!
- Mark as New
- Bookmark
- Subscribe
- Mute
- Subscribe to RSS Feed
- Permalink
- Report Inappropriate Content
Yes, you can use below
Filters Selected =
IF (
ISFILTERED ( MyTable[MyColumn] ),
CONCATENATEX ( FILTERS ( MyTable[MyColumn] ), MyTable[MyColumn], ", " ),
"ALL"
)
For detailed tutorial refer https://www.datapears.com/post/creative-ways-to-show-filter-selections-on-your-power-bi-reports
If this post helps, then please consider Accept it as the solution, Appreciate your Kudos!!
Proud to be a Super User!!
- Mark as New
- Bookmark
- Subscribe
- Mute
- Subscribe to RSS Feed
- Permalink
- Report Inappropriate Content
Unfortunately, that appears to try to solve the problem by creating a second visual dedicated only to showing the filter info. However, you led me to a solution that keeps the filter info in the main visual. Using your DAX, the measure can be added within a visual via the subtitle function in the Visualizations Pane>Format>General>Subtitle option.
- Mark as New
- Bookmark
- Subscribe
- Mute
- Subscribe to RSS Feed
- Permalink
- Report Inappropriate Content
And the other problem is that you have to specify every filter individually, which can be a real problem if there are dozens of filters. This solves that problem using DAX Studio. Take the results they put into a tooltip, and instead put that measure into the subtitle. Voila!


