- Power BI forums
- Updates
- News & Announcements
- Get Help with Power BI
- Desktop
- Service
- Report Server
- Power Query
- Mobile Apps
- Developer
- DAX Commands and Tips
- Custom Visuals Development Discussion
- Health and Life Sciences
- Power BI Spanish forums
- Translated Spanish Desktop
- Power Platform Integration - Better Together!
- Power Platform Integrations (Read-only)
- Power Platform and Dynamics 365 Integrations (Read-only)
- Training and Consulting
- Instructor Led Training
- Dashboard in a Day for Women, by Women
- Galleries
- Community Connections & How-To Videos
- COVID-19 Data Stories Gallery
- Themes Gallery
- Data Stories Gallery
- R Script Showcase
- Webinars and Video Gallery
- Quick Measures Gallery
- 2021 MSBizAppsSummit Gallery
- 2020 MSBizAppsSummit Gallery
- 2019 MSBizAppsSummit Gallery
- Events
- Ideas
- Custom Visuals Ideas
- Issues
- Issues
- Events
- Upcoming Events
- Community Blog
- Power BI Community Blog
- Custom Visuals Community Blog
- Community Support
- Community Accounts & Registration
- Using the Community
- Community Feedback
Register now to learn Fabric in free live sessions led by the best Microsoft experts. From Apr 16 to May 9, in English and Spanish.
- Power BI forums
- Galleries
- R Script Showcase
- Wordcloud with r


- Mark as New
- Bookmark
- Subscribe
- Mute
- Subscribe to RSS Feed
- Permalink
- Report Inappropriate Content
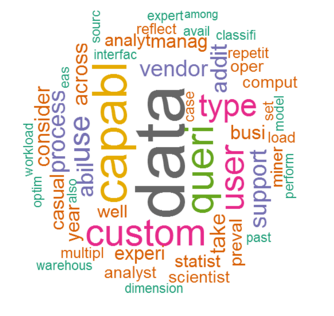
Wordcloud with r
Although there is a custom visualisation for Wordcloud now, I did this one with r in Power BI Desktop as you get a greater degree of control over it:
library(tm)
library(wordcloud)

words <- Corpus(VectorSource(dataset))
words <- tm_map(words, stripWhitespace)
words <- tm_map(words, content_transformer(tolower))
words <- tm_map(words, removeNumbers)
words <- tm_map(words, removePunctuation)
words <- tm_map(words, removeWords, stopwords("english"))
words <- tm_map(words, stemDocument)
wordcloud(words, scale=c(5,0.5), max.words=50, random.order=FALSE, rot.per=0.35, use.r.layout=FALSE, colors=brewer.pal(8, "Dark2"))
I have attached a sample .pbix file with the text from Wikipedia's 'big data' article and the R visualisation.
- Mark as New
- Bookmark
- Subscribe
- Mute
- Subscribe to RSS Feed
- Permalink
- Report Inappropriate Content
When I tried the original code, it worked with older versions of R, 3.2.3 but not newer versions of R, 3.3.1 and 3.4.2. The Corpus construction was returning only numbers which were then stripped out by the rest of the code causing problems. So, I hacked together a variation of the original code based upon comments and have a working version here:
require(tm)
require(wordcloud)
require(RColorBrewer)

datain = as.data.frame(table(as.character(dataset[,1])))
words <- Corpus(VectorSource(dataset$text))

words <- tm_map(words, stripWhitespace)
words <- tm_map(words, content_transformer(tolower))
words <- tm_map(words, removeNumbers)
words <- tm_map(words, removePunctuation)
words <- tm_map(words, removeWords, stopwords("english"))
words <- tm_map(words, stemDocument)

wordcloud(words, scale=c(5,0.75), max.words=50, random.order=FALSE, rot.per=0.35, use.r.layout=FALSE, colors=brewer.pal(8, "Dark2"))
The main change is the construction of the Corpus, VectorSource(dataset) becomes VectorSource(dataset$text)
This is based upon the original PBIX file included in the original post.
@ me in replies or I'll lose your thread!!!
Instead of a Kudo, please vote for this idea
Become an expert!: Enterprise DNA
External Tools: MSHGQM
YouTube Channel!: Microsoft Hates Greg
Latest book!: The Definitive Guide to Power Query (M)
DAX is easy, CALCULATE makes DAX hard...