- Power BI forums
- Updates
- News & Announcements
- Get Help with Power BI
- Desktop
- Service
- Report Server
- Power Query
- Mobile Apps
- Developer
- DAX Commands and Tips
- Custom Visuals Development Discussion
- Health and Life Sciences
- Power BI Spanish forums
- Translated Spanish Desktop
- Power Platform Integration - Better Together!
- Power Platform Integrations (Read-only)
- Power Platform and Dynamics 365 Integrations (Read-only)
- Training and Consulting
- Instructor Led Training
- Dashboard in a Day for Women, by Women
- Galleries
- Community Connections & How-To Videos
- COVID-19 Data Stories Gallery
- Themes Gallery
- Data Stories Gallery
- R Script Showcase
- Webinars and Video Gallery
- Quick Measures Gallery
- 2021 MSBizAppsSummit Gallery
- 2020 MSBizAppsSummit Gallery
- 2019 MSBizAppsSummit Gallery
- Events
- Ideas
- Custom Visuals Ideas
- Issues
- Issues
- Events
- Upcoming Events
- Community Blog
- Power BI Community Blog
- Custom Visuals Community Blog
- Community Support
- Community Accounts & Registration
- Using the Community
- Community Feedback
Register now to learn Fabric in free live sessions led by the best Microsoft experts. From Apr 16 to May 9, in English and Spanish.
- Power BI forums
- Forums
- Get Help with Power BI
- Desktop
- Re: EVM (BCWP, BCWS & ACWP) on specific period - M...
- Subscribe to RSS Feed
- Mark Topic as New
- Mark Topic as Read
- Float this Topic for Current User
- Bookmark
- Subscribe
- Printer Friendly Page
- Mark as New
- Bookmark
- Subscribe
- Mute
- Subscribe to RSS Feed
- Permalink
- Report Inappropriate Content
EVM (BCWP, BCWS & ACWP) on specific period - MS Project
Hi everybody,
Today I have a new ask 🙂
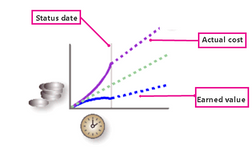
I want to display evolution of EVM (BCWP, BCWS & ACWP) on specific period.
But I don't know how I can do it.
I found BCWP, BCWS and ACWP into Projects Table, and after some bad attempts, I never found the correct date to put in axis to "create" the period.
I know it's simple, I want to create chart like this :
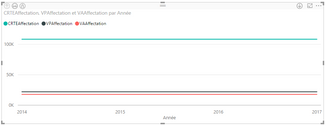
But I obtain this f*****g chart (with wrong date/period) :
Have you any idea / suggesting ?
Best regards 🙂
- Mark as New
- Bookmark
- Subscribe
- Mute
- Subscribe to RSS Feed
- Permalink
- Report Inappropriate Content
Hi @draner,
Can you share some detail content of your issue?(e.g dax formula, sample data)
Regards,
Xiaoxin Sheng
If this post helps, please consider accept as solution to help other members find it more quickly.
- Mark as New
- Bookmark
- Subscribe
- Mute
- Subscribe to RSS Feed
- Permalink
- Report Inappropriate Content
Hi @v-shex-msft,
I use oData connection on Project Online in french version.
I use default columns of the data source.
In next picture, you can see selected datas :
'PlanningsDeRéférenceProjet'[DateDébutRéférenceProjet] = 'baselineProject'[dateStartBaselineProject]
'Projets'[CRTEAffectation] = 'Projects'[ACWP] ActualCost
'Projets'[VPAffectation] = 'Projects'[BCWS] PlannedValue
'Projets'[VAAffectation] = 'Projects'[BCWP] EarnedValue
ACWP, BCWS and BCWP are correct but it's the last value.
I wanna get progress of ACWP, BCWS and BCWP at specific date in period.
I think I use wrong table to make it, but i don't know
Do you know how i can do it ?
- Mark as New
- Bookmark
- Subscribe
- Mute
- Subscribe to RSS Feed
- Permalink
- Report Inappropriate Content
Hi @draner,
I think you need to create relationship between these tables.(e.g. create a calendar table, add the relationships) If the value can't match the date axis, the value fields will show the static value at the line chart.
Regards,
Xiaoxin Sheng
If this post helps, please consider accept as solution to help other members find it more quickly.
- Mark as New
- Bookmark
- Subscribe
- Mute
- Subscribe to RSS Feed
- Permalink
- Report Inappropriate Content
How can I do it ?
I have no idea !
Thanks a lot !
- Mark as New
- Bookmark
- Subscribe
- Mute
- Subscribe to RSS Feed
- Permalink
- Report Inappropriate Content
Hi @draner,
You can take a look at below steps.
Date Table formula:
datetable =
var temp=UNION(VALUES(Table1[Date]),VALUES(table2[Date]))
return
CALENDAR(MINX(temp,[Date]),MAXX(temp,[Date]))
Then create relationship from table1[date] and table2[date] to calendar table's date field.
After above steps you line visual will calculate the relative value based on relationships.
Regards,
Xiaoxin Sheng
If this post helps, please consider accept as solution to help other members find it more quickly.
- Mark as New
- Bookmark
- Subscribe
- Mute
- Subscribe to RSS Feed
- Permalink
- Report Inappropriate Content
Were you able to solve this issue?
If Yes, Could you please provide me the steps needed to get this done or if possible the code used? Else if you were not able to get this done what workaroung method did you employ?
I am facing a similar issue while creating a EVM chart Programmatcally in MS project server 2016.
Regards
Agasthya
Helpful resources

Microsoft Fabric Learn Together
Covering the world! 9:00-10:30 AM Sydney, 4:00-5:30 PM CET (Paris/Berlin), 7:00-8:30 PM Mexico City

Power BI Monthly Update - April 2024
Check out the April 2024 Power BI update to learn about new features.

| User | Count |
|---|---|
| 109 | |
| 99 | |
| 77 | |
| 66 | |
| 54 |
| User | Count |
|---|---|
| 144 | |
| 104 | |
| 102 | |
| 87 | |
| 64 |


