- Power BI forums
- Updates
- News & Announcements
- Get Help with Power BI
- Desktop
- Service
- Report Server
- Power Query
- Mobile Apps
- Developer
- DAX Commands and Tips
- Custom Visuals Development Discussion
- Health and Life Sciences
- Power BI Spanish forums
- Translated Spanish Desktop
- Power Platform Integration - Better Together!
- Power Platform Integrations (Read-only)
- Power Platform and Dynamics 365 Integrations (Read-only)
- Training and Consulting
- Instructor Led Training
- Dashboard in a Day for Women, by Women
- Galleries
- Community Connections & How-To Videos
- COVID-19 Data Stories Gallery
- Themes Gallery
- Data Stories Gallery
- R Script Showcase
- Webinars and Video Gallery
- Quick Measures Gallery
- 2021 MSBizAppsSummit Gallery
- 2020 MSBizAppsSummit Gallery
- 2019 MSBizAppsSummit Gallery
- Events
- Ideas
- Custom Visuals Ideas
- Issues
- Issues
- Events
- Upcoming Events
- Community Blog
- Power BI Community Blog
- Custom Visuals Community Blog
- Community Support
- Community Accounts & Registration
- Using the Community
- Community Feedback
Register now to learn Fabric in free live sessions led by the best Microsoft experts. From Apr 16 to May 9, in English and Spanish.
- Power BI forums
- Galleries
- Data Stories Gallery
- 2015 UK General Election Results


- Mark as New
- Bookmark
- Subscribe
- Mute
- Subscribe to RSS Feed
- Permalink
- Report Inappropriate Content
2015 UK General Election Results
Hi all,
This report shows the results of the UK General Election from 2015 in a number of different ways.
Page 2 shows the breakdown of seats won by party. You can filter this by country (England, Wales, Scotland and Northern Ireland), which party came second in each seat, and also whether the result was a Gain (ie the winning party did not previously hold the seat) or a Hold (ie the winning party had held the seat before the election).
Page 3 shows the number of votes won broken down by party. Again you can filter by country, and you can also filter by multiple consistuencies and parties too. The latter two filters use the Smart Filter custom visual from SQLBI.
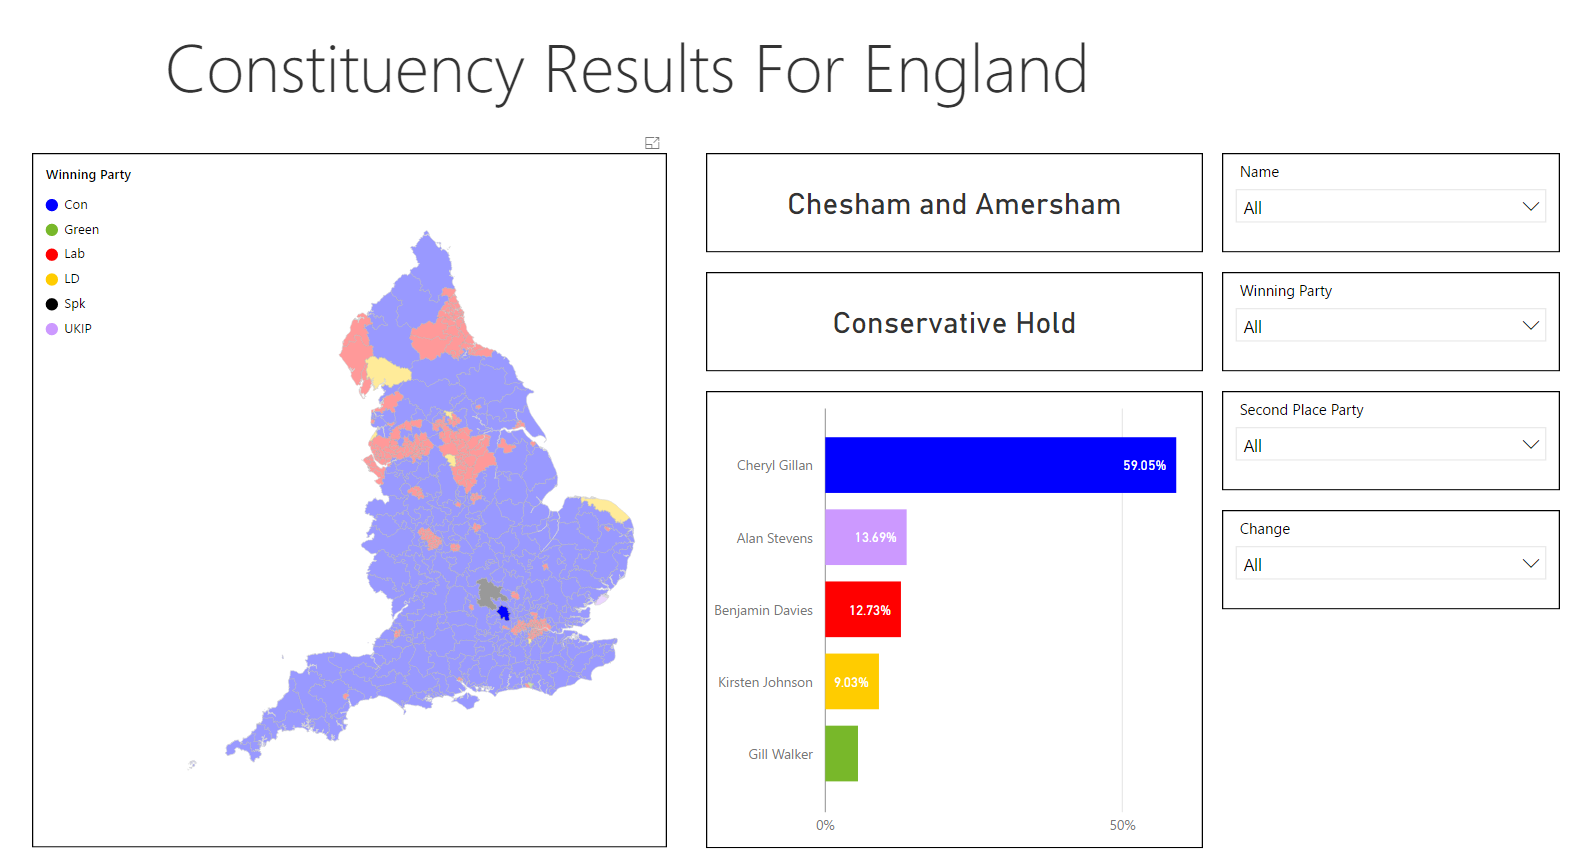
Pages 4-7 show the results for constituencies in England, Wales, Scotland and Northern Ireland. The map (built using the Shape Map visual) shows the constituencies in each country coloured according to the winning party, and you can select a constituency to see the votes cast for each candidate in that constituency. You can also zoom in and out on the map and filter using the slicers on the right-hand side.
Page 8 shows each constituency sorted by majority (the number of votes the winning party was in front of the second-place party). Again, clicking on a constituency in the chart will show the breakdown of votes cast in that constituency. In the slicers on the right-hand side is an option to filter the constituencies so you only see those where the majority was less than a certain number.
eyJrIjoiNDNlYWM0YjUtMTRhOS00MjMwLTgwNjMtMmFjYzkyMzEwZTZlIiwidCI6ImEyODQ0OTIzLTEyMTgtNGQzNi1hN2M1LTk1ODJhMzhhNGU1ZCIsImMiOjh9